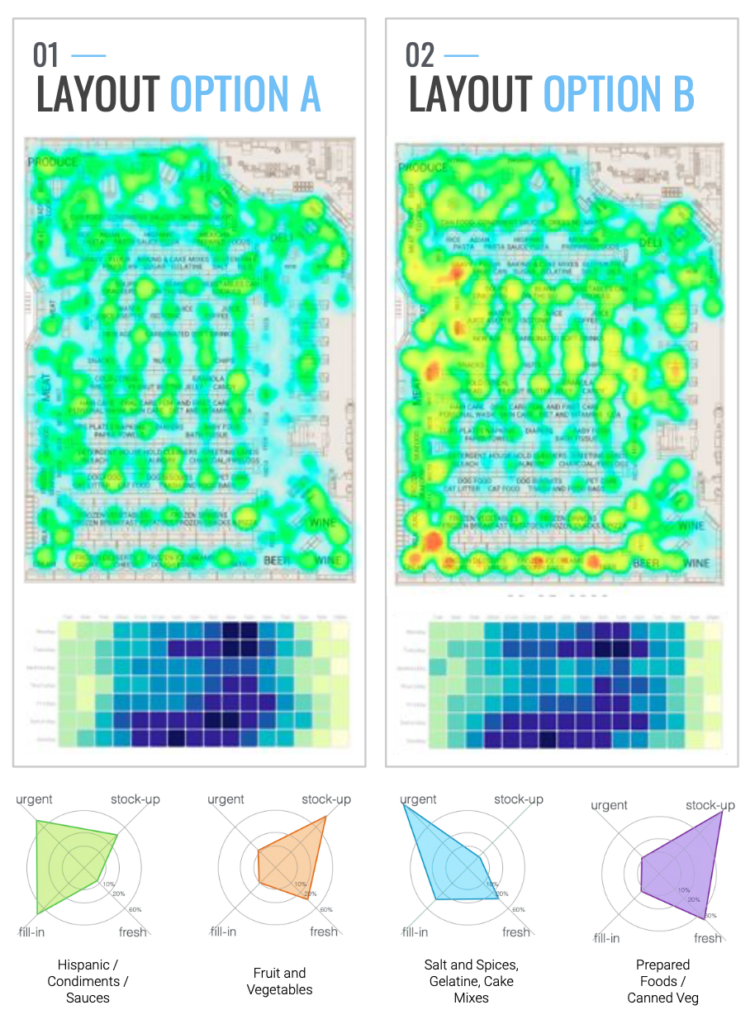
This is a variation of the customer flow report. According to traffic trends, it is possible to forecast customer behavior and identify which is the most frequented path. Hence, we are able to estimate the probabilities of customers moving to different directions around the store.

Thanks to this information, store managers can adapt their product display planning. Let’s say that in our store the snacks section is placed on the right side (the path chosen by 7% of visitors). In the last month, this section has not had the expected results, so actions need to be taken in order to foster sales. Taking into account that 79% of customers go straight when they reach this point of the store, a good idea would be to launch an in-store activation to attract customers to these products.