A shopping mission is the purpose of a shopping trip. The definition, and the four missions Shoppermotion uses, are in the glossary. This article is the case: placing a display by mission raised one campaign's sales by 18.3%.
Shoppers visit stores to satisfy multiple needs states, such as getting a bottle of milk and a box of cereals for their daily breakfast or purchasing ingredients for a healthy lunch meal the same day. This article reveals the value of the analysis of customers’ shopping missions in-store. It explains the way in which retailers differentiate groups of missions by measuring the shoppers’ journey during their visits. Eventually, two examples illustrate how groceries and FMCGs are applying this expertise to solve some of their toughest operational challenges.
Recognizing and grouping different shopper missions empower retailers to understand accurately the reason why customers visit their stores. Thus, learning how to optimise the in-store shopper experience and distribute their categories effectively. These tailored insights enable innovative methods to be implemented to communicate with the shopper and influence purchase decisions prior to their next visit.
A shopper mission is a goal for a particular shopping journey. Understanding them in advance drive new marketing and operational opportunities to retailers and manufacturers.
Classification of the shopping missions
By collecting customer flows in-store passively and anonymously, a Retail Intelligence solution such as Shoppermotion classifies shopping missions based on qualitative inputs. Journeys are automatically collected, processed, aggregated, filtered, and analyzed for different store formats and locations, representing the genuine interest of the shoppers in a wide variety of scenarios.
Even though there is a multitude of variables associated with a shopper mission, they are ultimately related to the interaction and focus levels during the visit path. The following figure represents a variety of missions based on two key parameters which are considered during every shopping mission analysis.
- Level of interaction: Distinguished between “focused” for journeys where there are a small fraction of dominant categories during the stay and “highly interactive” where dwell time is widely distributed among a significant number of categories.
- Visit duration: It is important to recall that shoppers are investing a significative time during the visit, and each second counts. The entire visit duration indicates the genuine interest of the customer. Accordingly, visits are compared to the average journey duration and then arranged between “quick” and “long journeys”.
According to the previous score, shopping missions are classified in four quadrants:
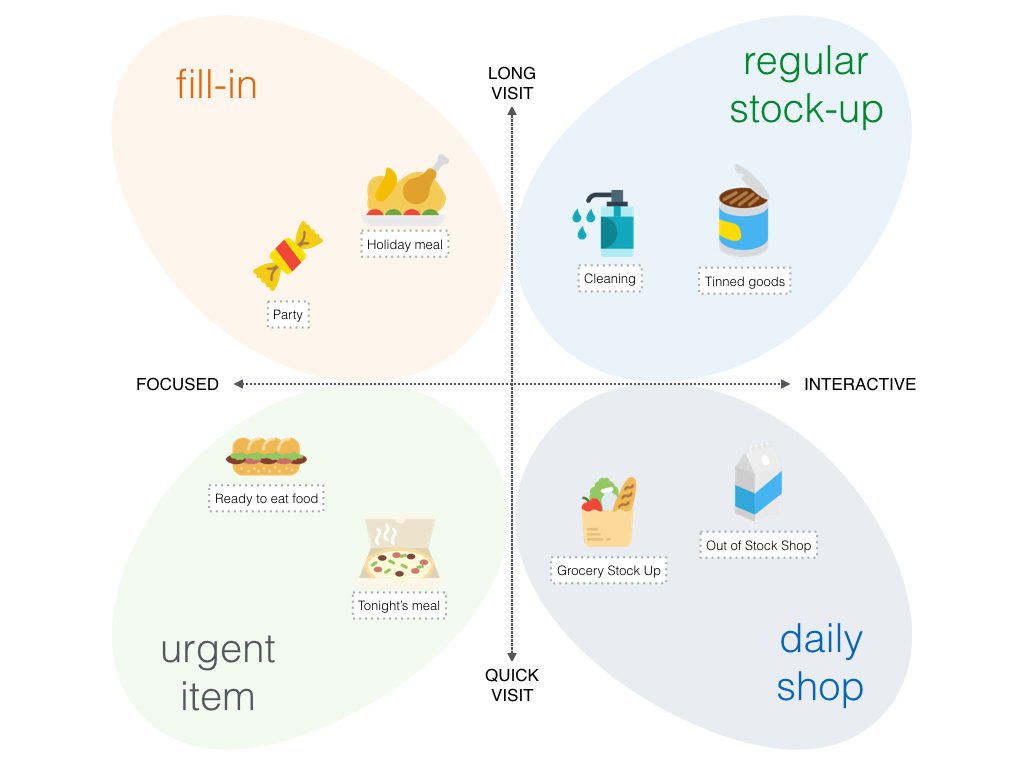 Visual classification of shopping missions depending on the level of interactivity and time in the store
As outlined below for each group:
- Fill-in: Visit a few grocery sections and find products which need to be re-stocked. Shoppers will venture to the grocery store when these particular grocery items have dwindled and need to be replenished before their next bulk grocery shopping or a particular event requires an unexpected visit to the grocery store.
- Regular stock-up: Visit a wide variety of sections in bulk to be able to fill the refrigerator for the up and coming weeks. The shopper normally plans their visit in advance as these shopper journeys require more time and planning. This particular group also tend to entail the use of shopping carts.
- Urgent item: Visit one or two categories within the store whereby the customer ignores all other categories and solely focuses on their immediate needs. Meaning the shopper does not deviate from their intended journey.
- Daily shop: Visit certain categories specific to products for daily use with a focus on fresh and perishable items, most likely to be consumed on the day of purchase.
Quantitative descriptors
Any clustering algorithm requires assessable metrics in order to automate the above classification. Shoppermotion tracks 20+ quantitative inputs for every shopping mission to enrich the internal statistical model.
Day of the week
Distinguishes between weekdays and weekends, including holidays and special occasions. Depending on each store location and store format, this metric will result very comprehensible and self-explanatory .
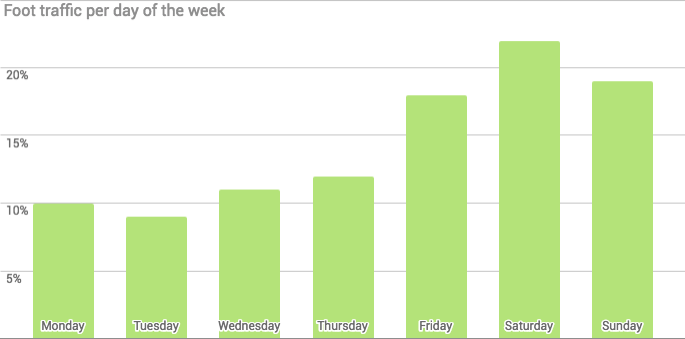 Percentage of shopping missions tracked per day of the week.
Hour of the day
Shoppers captured at the beginning of the day could be unemployed or retired customers. However, purchased made during the evening are generally made by working professionals.
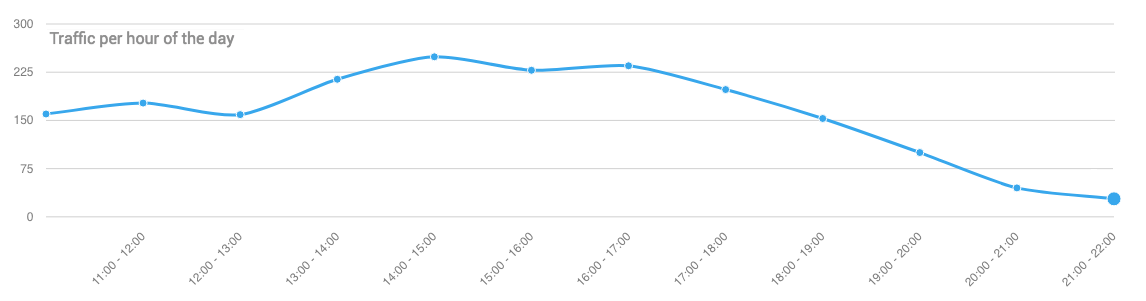 Above graph represents the daily foot traffic per hour representing the daily visits to the grocery store.
Length of the journey
Calculated as the number of sections completed during the purchase. Long journeys belong to inspired visitors, stock-up or replenishment while short journeys are usually for quick pick-ups.
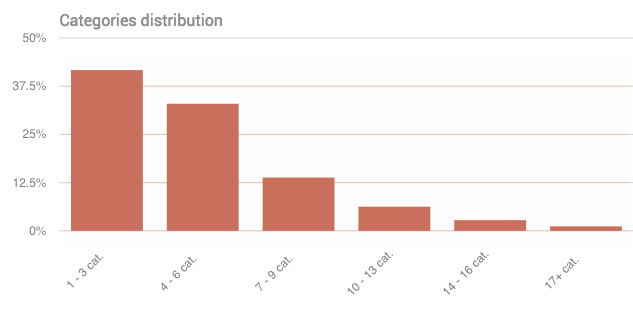 Above graph represents the categories visited per journey metric which helps to estimate the type of mission.
Shopping tool
The use of either shopping carts or baskets indicates the shopper’s overall intent and the time originally allocated to said purchase. Shopping carts are generally chosen for long routes (typically bi-weekly or monthly purchases) while small shopping tools such as baskets are chosen for more spontaneous or quick stays (typically daily or weekly shopping).
From a spatial point of view, there are additional examinations offered by Shoppermotion such as the correlation matrix study to improve the cross-selling strategies or better category management using Business Intelligence.
Case studies
Migration from hypermarkets to convenience stores
One of the largest French retailers studied the in-store shopping missions in certain hypermarkets in Indonesia. During twelve months of study, their shopping mission groups varied significantly as shown in the following Figure.
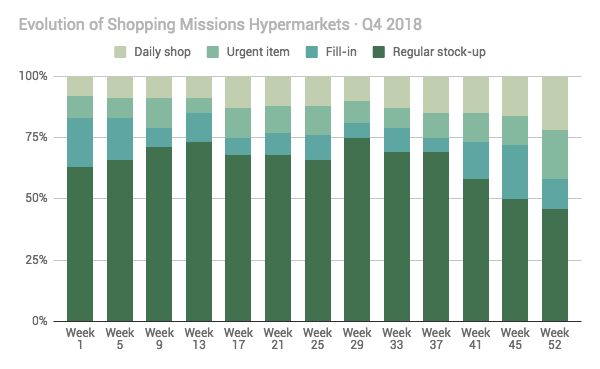 Evolution of shopping mission groups in 2018 – Hypermarkets
This variation pointed to a rise in the consumers’ interest for shorter and focused experiences in-store. At a close glance, the shopping mission distribution throughout 2018 points out that daily shop and urgent item missions almost doubled progressively during the second half of the year. Applying the same time range in the foot traffic analysis per category, the result is that fresh and ready-to-eat categories stand out above the rest of the shopping missions regarding average dwell time.
 Above graph represents dwell time evolution in-store. Fresh and perishables (right) yield a higher interest compared to other categories (2018)
This fact, along with the sales evolution, leads to the comprehensive conclusion that customers in the region were quietly claiming over the year more convenience footprints in their hypermarkets, which is easier to solve with easier access to ready-to-eat categories and fresh fruit and vegetables and with a closer location to the entrances to complete the shopper journey sooner.
Best-in-class on how to activate an in-store promotion effectively
In-store shopping missions examination is indeed a helpful mechanism to find out the optimal time frame to launch a new product activation or the implementation of a new activity or marketing tactics. Brands often struggle to gather key metrics and review the true outcome of their local activations within their categories. As they are unable to effectively track and measure their customers experience, overall store performance or consumer understanding and therefore, appear powerless to give answers to subjects such as:
- Which would be the best moment to run my new product testing?
- How long should this new event last?
- Shall I start on Monday morning or maybe Wednesday afternoon?
- Which store format is the most suitable one for this promotion?
- Which is the main shopping mission cluster that visits my promoted category?
These are some examples of common questions that Business Developer Managers ask themselves every day. Analyzing and clustering the shopping missions throughout the week presents a clear answer to the previous points.
One of our clients faced such challenges regarding one of their innovation brands a new NARTD (Non-Alcoholic Ready-To-Drink) in Brazil. The success of their campaign was significantly related to the exact moment of the week they activated their campaign. Underpinned by the strategic placement of their brand-new display which was based on their target customers’ shopping mission profile.
How? Before the activation went live we carried out specific research to understands the most optimal time and place for the activation to go live to secure a positive ROI. The following figure highlights the top-5 spots to install the display, the 4 inner circles indicate the percentage of shopping mission groups that transited in each particular area during the previous 3 months. The outer circle represents in a classic heatmap scale (the reddish, the higher, the greenish the lower) the foot traffic registered in the area and therefore the amount of impact expected.
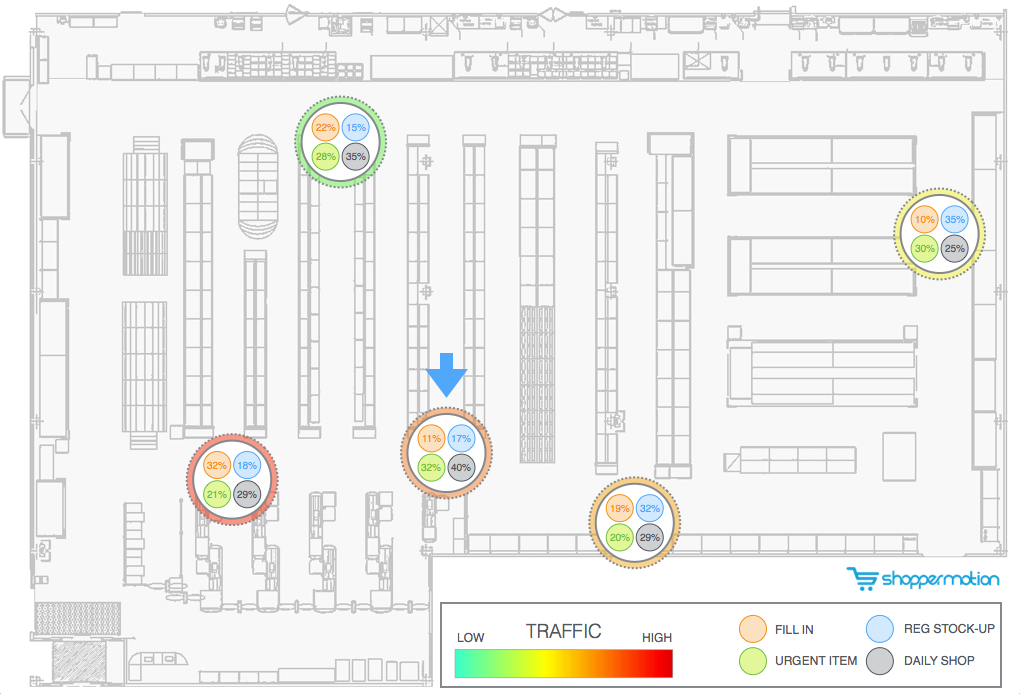 Percentage of shopping missions’ groups on different spots of the store
For this particular project, the optimal placement of the display is marked with a blue arrow. You will find more information covering the optimal location of in-store media in the article analysing the performance of the main aisle of the supermarkets.
In this case, the decision was taken based upon the following reasons:
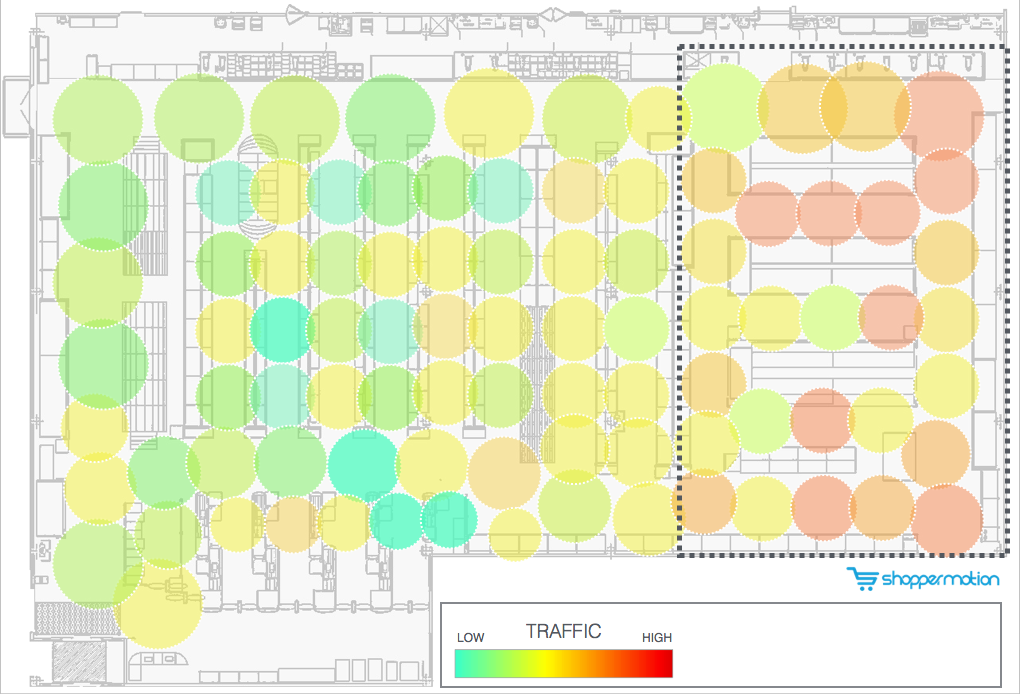
- The foot traffic heatmap in the region is 68.2%. Although it is not the most transited area of the store, its popularity is above the average.
- The percentage of shopping missions categorized among urgent item and the daily shop (the two most interesting for this particular FMCG) is dominant in the area (72%).
The second question is related to timing: when should this campaign start? The client was interested in an urgent item and daily shop mission. To give the best solution we built an effective plan to ensure the most conducive moment was pinpointed to those key shopper missions in order to effectively activate the new brand in-store. The following Figure represents the aggregated value for the last three months.
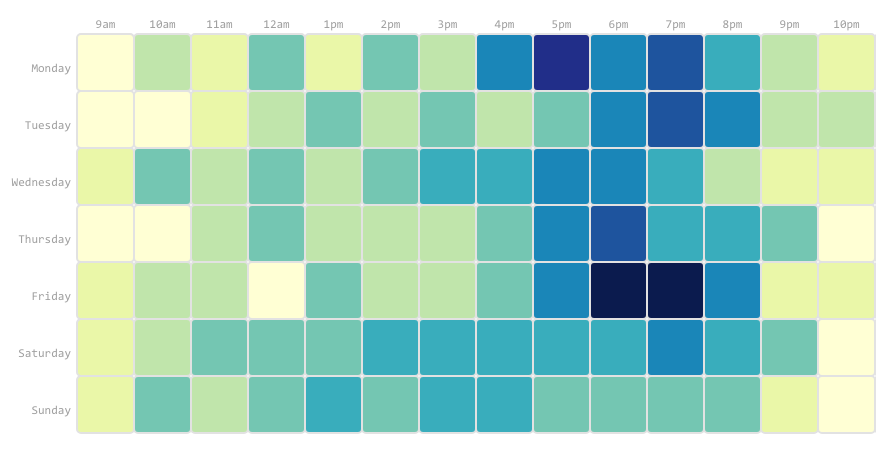 Power hours for urgent item and daily shop shopping missions
Testing campaigns started on a Friday evening (after 5 PM) to maximize their impact based on the shopping missions analyzed in the supermarket.
These two conclusions were applied and accounted for 18.3% raise in the sales of the campaign compared to the previous campaign strategies.
Conclusions
This article carries an extended review of the importance of examining the in-store shopping missions in brick and mortars. Investigating different trends helps Category Managers and Retail owners make better in-store strategic and operational decisions.
With the aid of Retail intelligence tools such as Shoppermotion, retailers and manufacturers are now prepared to measure, understand and make accurate decisions in-store.