In every store, regardless of its layout, you will most probably cross the traditional main aisle. It is usually located in a way that provides a panoramic sight of the key categories and located in the central area of the store. The main aisle, wide and spacious, improves the overall experience of the shoppers journey, ensuring the search for their favorite products is not only easier but it also allows their shopping cart to maneuver freely throughout the aisle. Therefore, it is imperative to understand the customer behavior in the main aisle to generate an increase in sales.
Customer flow answers to tough questions
It is highly likely that during the shopper journey, the customers will enter the main aisle directly from the store entrance. Then, having landed there, they will unconsciously begin to purchase due to the in-store marketing promotions attracting their attention. Generally, retailers invest a considerable amount of time designing in-store strategies in order to measure every movement and purchase that happens within this particular zone.
Key Variables such as dwell time or predominant flow direction in the main aisle help them evaluate the categories performance and improve the in-store advertising and displays location. Additionally, Shoppermotion’s dashboard allows to review the customer flow on a daily basis, which provides retailers and manufacturers a meaningful formula to measure the conversion rate of the endcaps and evaluate the performance of the promotional campaigns.
Understanding the customer behavior with such laser cut accuracy has become a basic need, as a large share of the in-store promotions is located within a few meters in the main aisle.
Reviewing the customer flow on a daily basis provide retailers and manufacturers a meaningful formula to measure the conversion rate of the endcaps
Previous ways of working, created a challenging environment to be able to measure the Key Variables in such a crucial aisle. The findings and observations from the shopper journey used to be taken by hand. Such an archaic process is simply not scalable and outdated.
Nowadays, thanks to advancements within the tech industry such as Shoppermotion, it is now possible to develop tasks such as product placement optimization, layout A/B testing and purchase impact promotion campaigns efficiently but more importantly, automatically. Therefore, analysts and data scientists can invest their valuable time wisely to comprehend the customer behavior in their stores and in the main aisle, thus planning and strategizing effectively in an objective manner.
It does not matter if you are a Store Manager, a Planogram Designer or a Category Manager, the everchanging landscape of today’s shopper means it is becoming more and more challenging to find the answers to questions such as:
- Which is the percentage of visitors that travel end to end of the all main aisle?
- Which are the ebbs and flows for each planogram?
- How much time does a shopper need to pass through the main aisle and at what pace?
- How do promotional areas affect the foot traffic of the main aisle?
We will go through different examples based on real scenarios and the solution adopted from an analytical perspective:
Use case: Customer flow in a supermarket
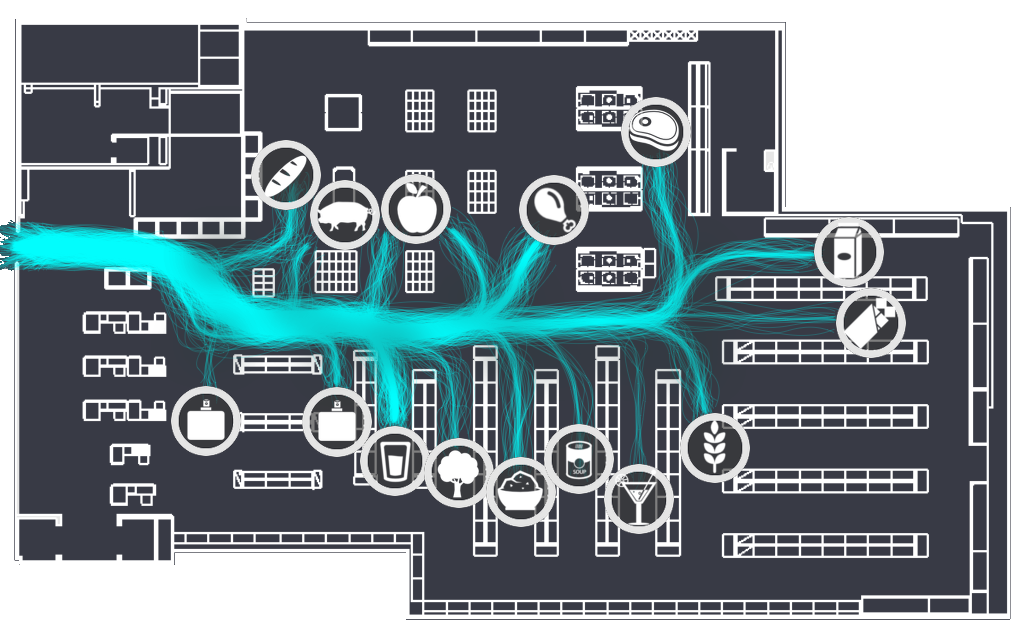
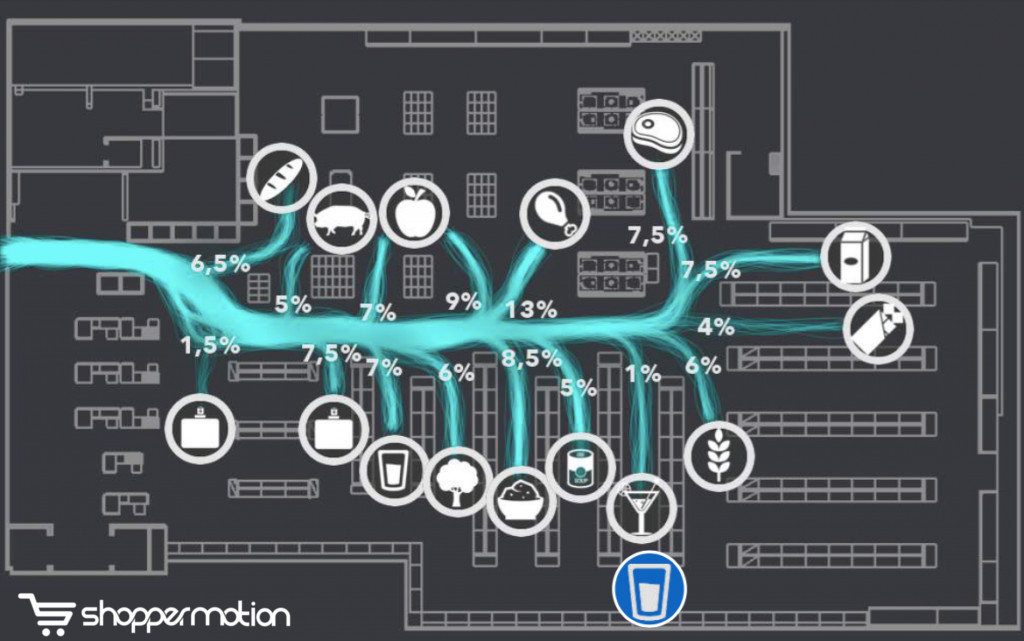
The following represents the results of the aggregated analysis of 20.000 shopping missions in a grocery supermarket in Madrid. This study is centered in the central area of the layout. As their journeys progress throughout the aisle, foot traffic fades gradually right to the back of the store. Shoppers will leave the main aisle as soon as they recognize an attractive display in the neighboring categories.
And the Figure’s legend is shown below.
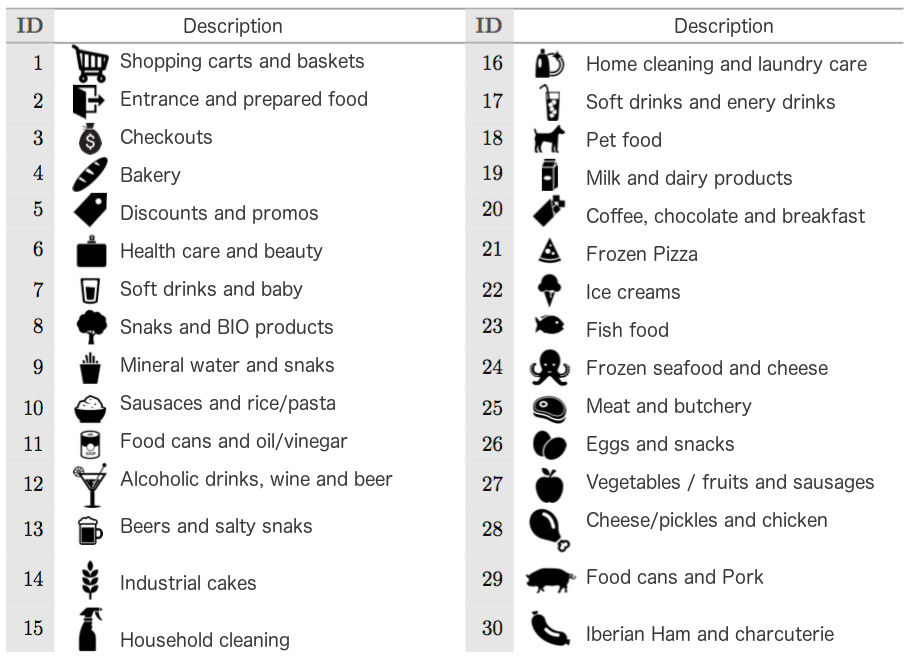
Visual representation of the categories
The first fundamental question that arises is related to the amount of traffic directed towards fresh food, cured meats, and fish (at the top of the map, the left side of the main aisle from the entrance). 48% of the customers felt attracted by the fresh food areas at the beginning of their purchases. This is a very adjusted rate considering that it is a convenience store. However, the retailer had a substantially different concern.
48% of the customers felt attracted by the fresh food areas at the beginning of their purchases.
For this study, the retailer wanted to find out which was the category with the greatest impact on the main aisle’s performance and dig into the details. They had previously noticed a decrease in sales in the back area of the store and the situation urged the launching of a new strategy to retain foot traffic as much as possible in the main aisle. If they could keep the customers in this area, dwell time would increase and so the return of investment of the endcaps and promotional islands.
Effect of the displacement of a category in the main aisle’s flow
The first step in facing this challenge included recognizing the most frequent categories visited nearby the main aisle. Non-Alcoholic Ready to Drink (NARTD) is positioned in the third aisle on the right side. It attracted 15% of the entire traffic initiated at the entrance of the store. The action taken was to push the category to the back of the local, keeping the traffic in the main aisle a few meters further. This change of layout was performed during the mid-term, so there were enough samples before and after the change.
The following Figure represents the change in customer flow in the main aisle before and after the change of location.
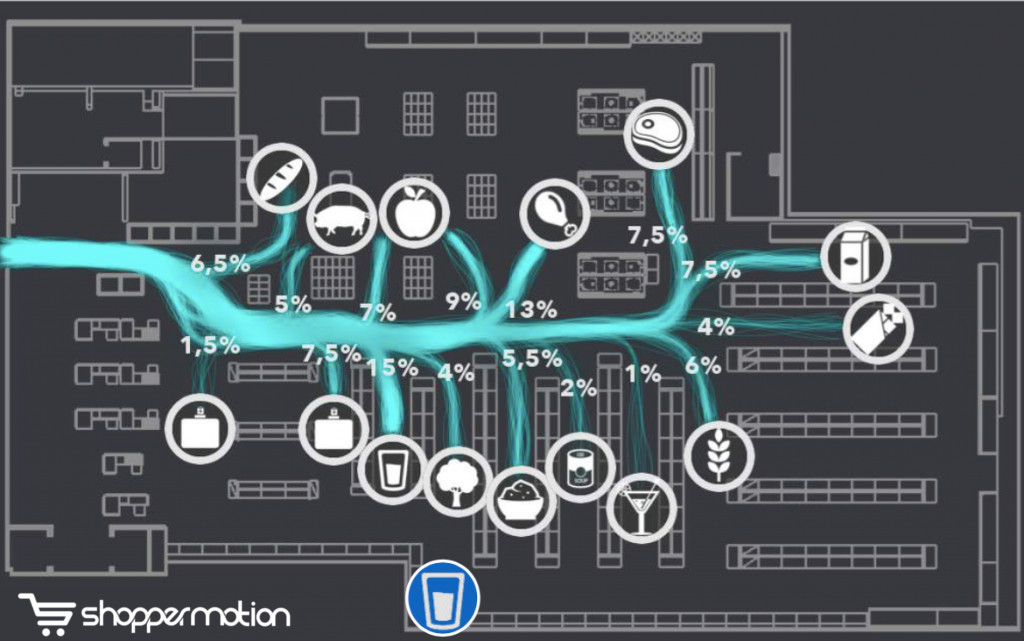
Shopper flow before and after the relocation of the category
Finally, as expected, by displacing such an important category, shopper flows are shortly updated affecting the adjacent of the categories. Most of the changes have been very successful. In the following section, the performance of the endcaps will be measured by the influence of these variations.
An increase of ROI on the surrounding shelves
The six shelves received an average 7% increase in traffic. This addition meant a straight bump in promotional sales of 3.4% after this variation in the main aisle and therefore, a small change in the NARTD location has made a relevant impact on the customer behavior on the surrounding categories and sales.
Conclusions
Applying retail intelligence is a powerful lever to make better in-store decisions. By means of the Shoppermotion retail intelligence platform, it becomes simpler to measure, compare, and track shopper paths and how the customer experience directly impacts the bottom line for every store.