In our previous post Cross-selling Analytics: Discovering the Correlation Matrix we introduced the Correlation Matrix, exploring its performance and some of its characteristics. One of the leading usages of this Matrix applies to cross-selling strategies. In this post, we will go through the 5 steps required to boost your cross-selling strategy.
For the uninitiated, cross-selling is the action or practice of selling an additional product or service to an existing customer
When done professionally, cross-selling can increase customer satisfaction and business revenue by simply making available products that match or go with the previously selected product. In most scenarios, items that can be cross-sold would have a high-profit margin in comparison to the original goods.
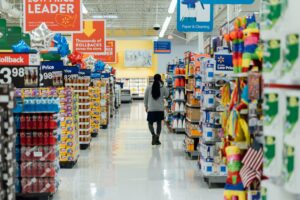
Each time a shopper stops at a certain zone of the store, Shoppermotion ties this zone with all the previous categories visited during the same journey. After collecting data from a representative number of customers, it extracts the connections, correlations, and patterns from the shopping journeys. Therefore, the Correlation Matrix collects associations between many categories from a behavioral point of view.
This Matrix is utilized to make appropriate and timely decisions regarding store management. To this end, we are going to take a deeper look into 5 practical ways by which we can boost cross-selling strategy and sales using the correlation matrix.
Step 1: Optimize Category Management
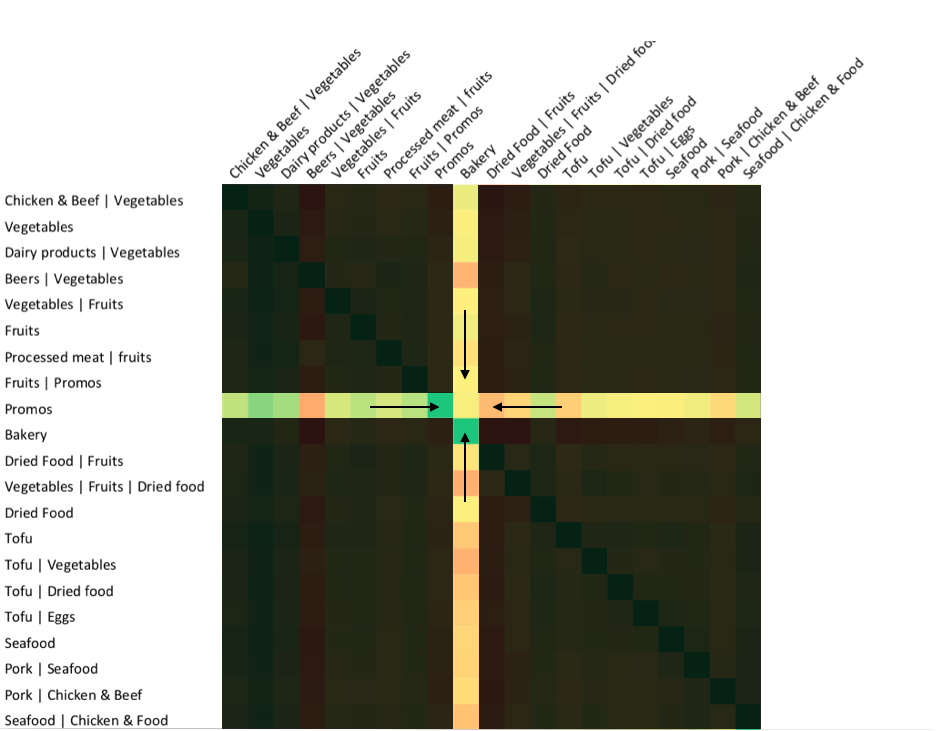
A frequent query for store managers is how many shoppers that show interest in a given placement of the store, do so in other areas of the store. For instance, how often do shoppers who are attracted by the Promotional area also visit the Bakery category during their purchases? In accordance with the following example, we just need to cross both sections row and column to find that only 29.97% of the shoppers do so. The higher the percentile indicates how much more emphasis needs to place on the links (interaction or proximity) between these categories.
This can easily be done by placing categories with higher correlation closer together, thereby creating paired chains around the store and allowing the customer or shopper see related items more easily and creating a purchase desire within them.
If you want to extend this point, there is a complete study regarding business intelligence in retail applied to category management.
Step 2: Boost your in-store digital signage
We can use this piece of information to activate our clients during their purchases. What first needs to be done is to cross this value with the sales in both categories. This match will tell us if our shoppers are converting well in both places by making sure that their baskets contain items on either side. We should proactively help them by offering solutions based on their behavior. For instance, we could promote a healthy receipt to cook a delicious Seafood Tofu Stew and illustrate our visitors a better way to identify the checklist of ingredients easily.
Besides that, by tracking correlation changes over time, we will be in a perfect position to recognize and forecast emerging needs and trends among our visitors.
If this is taken from another perspective, one can see that herein lays an opportunity for retailers to promote certain brands and specific products which fall into the correlated categories. Simple ads and banners or other signage can be used to increase the sales of whatever specific brand in the correlated category needs to be promoted. Which in turn leads to higher sales of that item, therefore resulting in a boost of our cross-selling strategy.
Step 3: Maximize Cross-selling opportunities
One of the most attractive features of the Correlation Matrix falls in its actionability. Just looking at the numbers returned by this matrix, we can spot those areas that are underperforming in terms of cross-selling opportunities in three steps:
- Pick up a target section that you would like to improve and determine those categories that hold a logical relationship with it (e.g., white wine — fish or beers — snacks).
- Generate the cross-correlation matrix for one particular period of time on your dashboard and find out the sections that returned the lowest values in the correlation matrix for that category.
- Check if any of the related categories are in the low correlation list. These will be the areas of the store that are supposed to be tied to the target section and yet do not hold a relevant foot traffic correlation.
Once this has been accomplished, the general organization of the store would change into more productive and creative opportunities for more sales. We must remember here that the goal is to give the shoppers not just multiple choices within a category but the understanding that there exist related items to the product being purchased within easy reach. By doing this, we will boost our cross-selling strategy.
Step 4: Exploit optimal cross-sell locations
Following the previous indications and the non-symmetry of the matrix, we may find pairs of sections with a low correlation in one direction and not the other way around. Let’s put an example in our previous scenario: we will focus our attention on Bakery and Dairy categories.
As it usually happens, these categories hold a strong correlation as the stock offered on their shelves is often related. However, up to now, we could only measure their correlation based on sales and never from the behavioral point of view. The following Figure represents the cross-correlation between the Bakery section and the Dairy section in both ways.
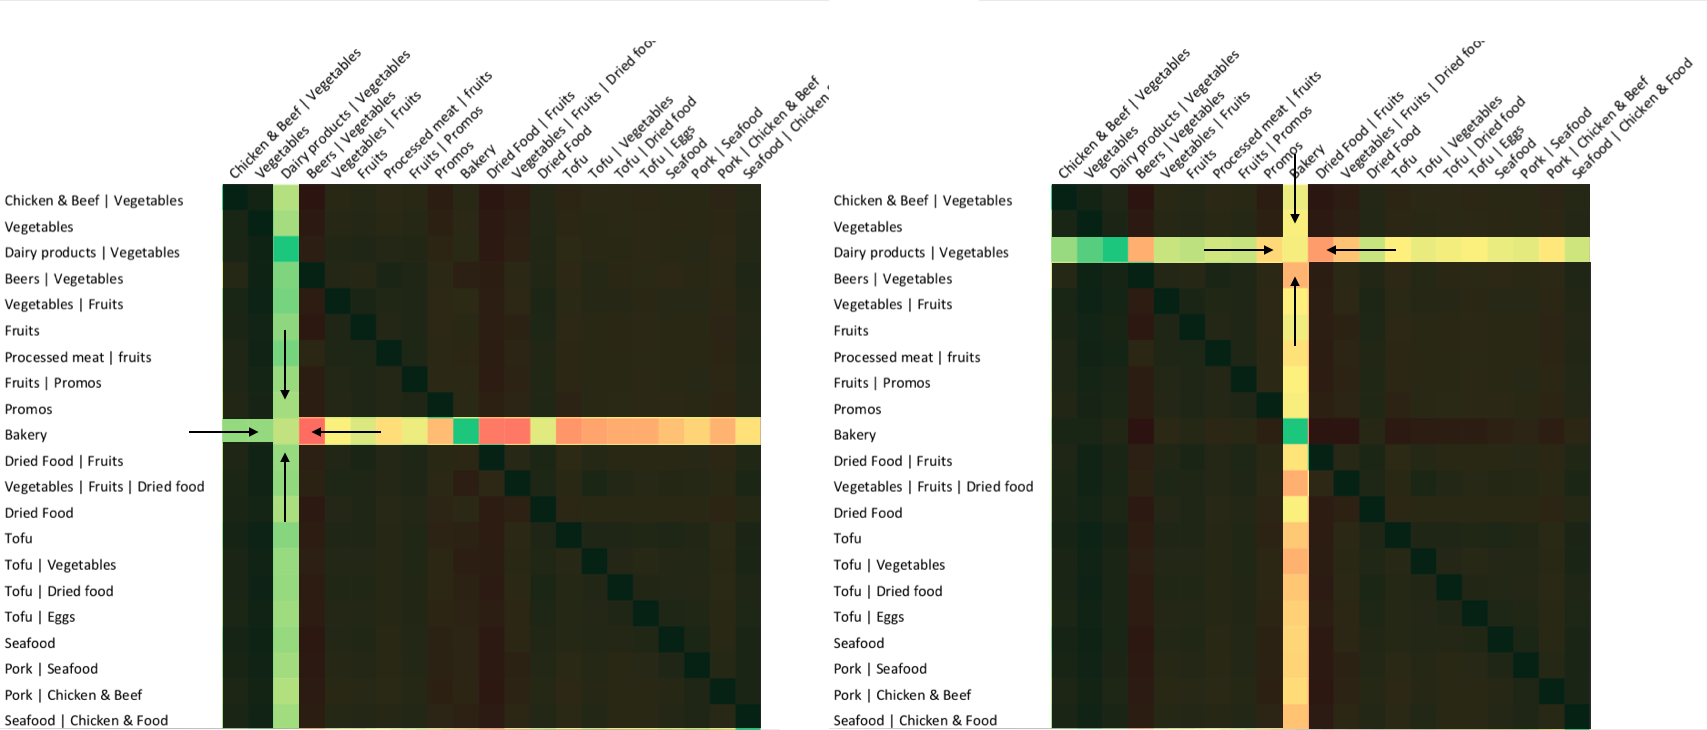
One in every two shoppers interested in Bakery passes by Dairy category during their visits. If the same process is calculated in the other direction, only 28.8% of the shoppers that stops in the Dairy category walk through Bakery.
In this occasion, the rate of journeys which visit Bakery knowing that they are also passing through Daily is pretty low even though both sections should be strongly correlated. It presents an excellent opportunity to increase cross-selling among them by placing some catching products from the Bakery section in the Daily category. A popular example of this is placing freshly baked bread right next to butter brands.
Again, the goal here is to take full advantage of cross-selling locations within the existing layout of the store and place items that have a high correlation percentile and a high-profit margin together.
Step 5: Tackle the second-floor challenge
A very frequent difficulty for the expansion teams appears designing planograms with multiple floors. These configurations are usually misleading and raise some questions such as:
- How would we encourage our shoppers to visit the upper-floor categories?
- Which is the profile of the shoppers that browse upstairs versus downstairs?
- How many foot traffic may we be loosing in the upper area?
- How do we encourage our visitors to browse in the whole store?
The following Figure represents the Correlation Matrix for a multi-story venue.
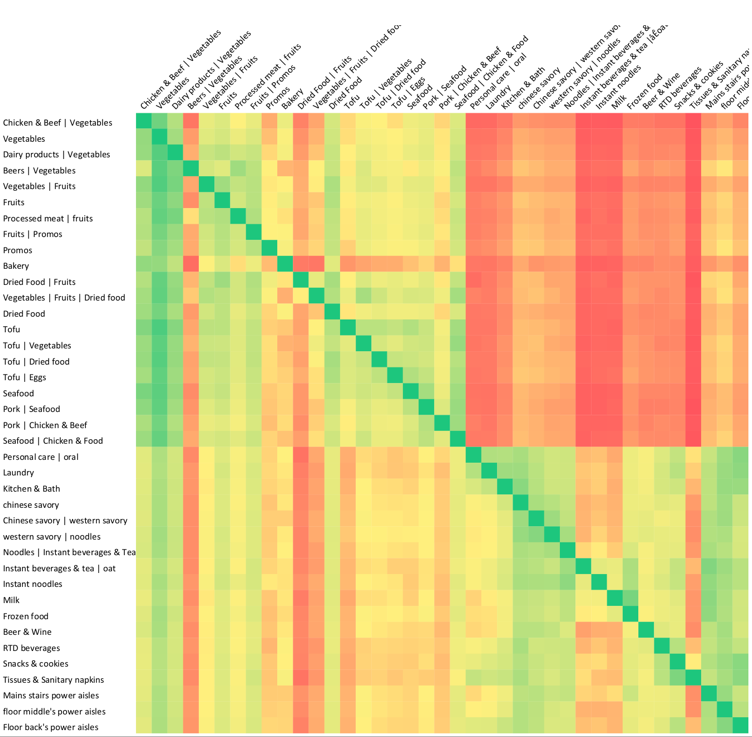
If we look closely at the correlation matrix of this particular store displayed above, we will be in a good position to solve these questions and many more. There are four peculiar regions easily differentiated in the matrix as spotted in the right side of the previous image. The following Table describes them from a high-level perspective extolling how foot traffic behavior differs widely among shoppers that go upstairs and visitors that remain on the ground floor.
[table id=3 /]
In a Nutshell
The objective for any store is to make as many sales as possible within the smallest period in time while engaging the customer to his/her maximum purchase potential, and having the right tools to make this happen is essential for any retailer, store or shop.
The Correlation Matrix is a powerful tool, when used correctly, to understand customers’ behavior in physical stores and translate that information into actionable decisions. So following any or all of the 5 listed steps here will allow for a better understanding of the data while making it more profitable and boost your cross-selling strategy.
As long as your focus is to create a high percentile Correlation Matrix within the store, following these steps will lead to higher sales and a higher profit margin while also providing to the needs of your customer, giving them a larger variety of visible choices and selections.