At the precise moment our customers cross the entrance of the store, it’s nearly impossible to predict what will be their next move. For that reason, it is essential to take a moment and examine the traffic flow. With this invaluable information at your fingerprints, you will be able to identify dead spots or impassable corners to effectively manage your retail space to increase profits and drive positive ROI. In this article, we will explain how cross-selling results can be augmented by analyzing the correlation matrix.
How the correlation matrix works
One of the latest features designed by Shoppermotion to solve this common challenge is the Correlation Matrix. This tool has been released as an important part of our in-store intelligence suite and provides new possibilities for cross-selling analytics in brick and mortars. It measures the probability of a shopper stopping at a certain category assuming that has stopped at any other section of the store, successfully tracking the full experience of the shopper journey.
You can download the XLS file for this example for free from here.
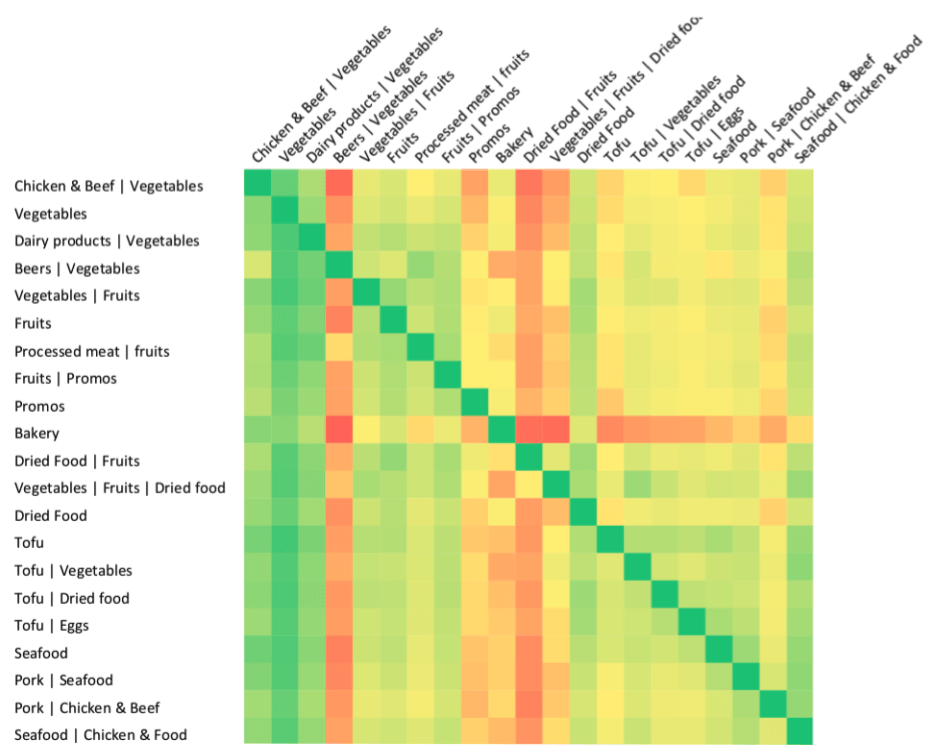
In order to generate the Correlation Matrices, Shoppermotion’s technology tracks the movement of each shopping tool in-store, from the entrance to the checkouts passively and anonymously. After cataloging a number of shopper journeys within your stores[note] Representative data can be generated at the moment your store has analyzed at least 10.000 journeys in the previous three months[/note], a bespoke dashboard will be generated displaying a Correlation Matrix of the analyzed data compiled as illustrated in the below Figure.

Rows and columns contain all the categories within our store. Each cell represents the likelihood of shopper journeys passing through a section on the Y-axis (Section A) and also passing through a section on the X-axis (Section B).
The greener the cell becomes, the higher the probability that the column section will also appear on any shopper journey that crosses by row section.
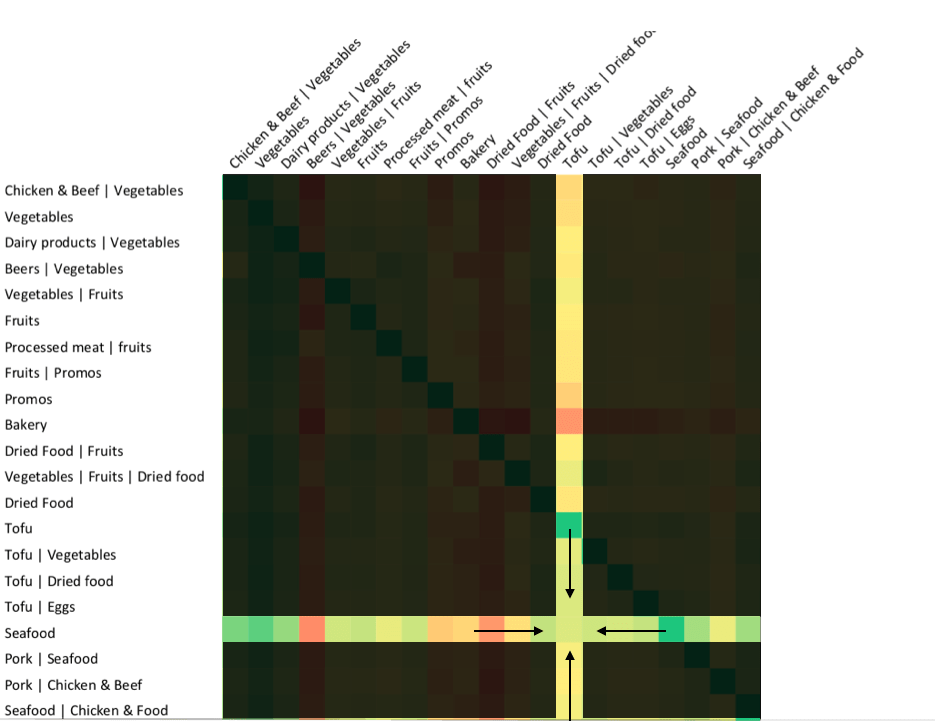
For instance, if we take the previous matrix as an example, it is possible to measure the correlation between Seafood and Tofu by just crossing both rows (Seafood) and columns (Tofu). The correlation matrix asserts that 38.9% of the shoppers who stop by Seafood during their visits also spend relevant time near the Tofu category.

The symmetry of the matrix
It is worth noting that the correlation matrix is rarely symmetrical. This is due to the fact that each shopper’s journey is different and therefore crosses a diverse number of categories. i.e., The number of shoppers that visit the Vegetable category is not the same as the Bakery category. Therefore, the probabilities of correlating these categories vary.

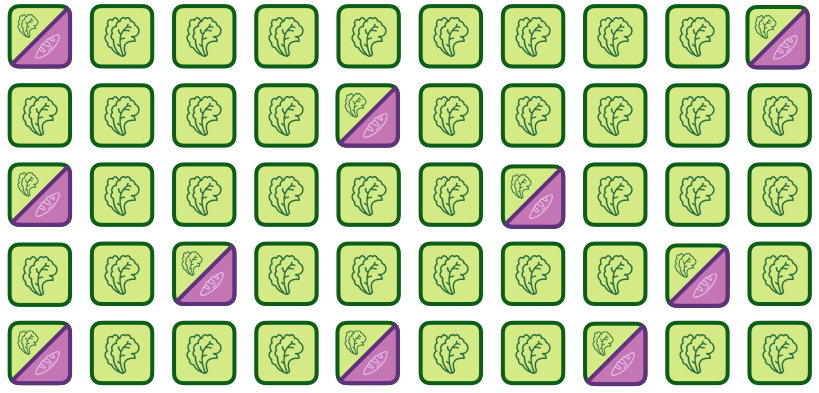
For instance, let’s assume that we are analyzing 50 journeys in one of our supermarkets and all the journeys stop at the Vegetable category (green boxes) but only 10 of those journeys stop also in the Bakery category (green + purple boxes). The cross-correlation between the Vegetable and Bakery categories would be 20% as only one-fifth of the shoppers followed this journey. However, if we measure the correlation backward (that is, from the Bakery to the Vegetable categories) the result would be 100% as all the registered journeys that stopped at Bakery did also stop at the Vegetable category during their purchases.
A powerful tool for cross-selling analytics
The Correlation Matrix is a powerful tool that opens new ways of visualization of our shoppers’ behavior. With the aid of this metric, our clients are able to measure the linkages between their categories in an empirical way generating an uplift in sales and increasing their competitive edge. The next article continues this interesting topic maximizing the sales using this particular tool. Its application is directly used for cross-selling analytics and in-store decisions. Due to this increased visibility, our clients manage their stock in a more agile manner and limit the risk associated with today’s forever changing landscape within the Retail Industry.


