In a previous article, we talked about recognizing various end caps intelligence in retail companies and making maximum use of them to increase sales and exposure. This, however, is not the end of our analysis and dealings with the end caps and Business Intelligence in retail.
Today we are tackling the following end cap questions:
- From every hundred shoppers that pass-by our end cap, how many converted into a sale?
- How many customers did this SKU impact during the promotional calendar taking into account end cap exposure and its original location?
There are multiple reasons to seek this data, but the top three includes:
- Measuring exposure of new products placed at the various end caps and see how well they have done.
- Note how well customers react to the advertisement placed at those locations
- And most importantly see the difference in sales before and after the end cap promotion.
However, these are not the only things we are looking out for. We would also like to know where our customers are coming from before reaching each end cap and where they go afterward. Plus understanding the customer’s purchase impulsiveness is also a key matrix we should keep track of.
One of our global retail partners recently reached this point in some of their stores around the EMEA region. It was now time to break down the results of the changes made to their various end caps. We will be using this data as our reference to explain what we found and what can be achieved.
Retail endcaps intelligence
As always, our focus is on the data and business intelligence we obtain in-store and how we can leverage each shopper’s movement within the store. Then we merge this with sales and figure out how useful the output of all this will be towards key management staff such as the category manager, store/sales manager of the operations manager. Today, we are focused on retail end caps and how their analysis will make our Business Intelligence reports completely actionable.
The data will be able to give us a first-hand view, which in turn helps in determining the right product and KPIs for the right public. This point is key and can not be overstated. Store managers and category managers are usually very busy, always solving issues in the store (stock breaks, logistics, customer service, etc.) sometimes they cannot consume data from a dashboard, filter information and obtain relevant insights on their daily basis. They need to digest BI reports with the right information, already processed and synchronized with other variables in their stores (aggregated sales, promotions calendar, staff schedules, etc.).
This is where solutions like ours come into play by simplifying and converting the mass of information into concise, actionable intel
Our analysis
After taking a look at the result, we found some very interesting conclusions. This was by far, one of the most interesting data results that we can offer them. The company launched a series of promotions, but they don’t know how good they had turned out. Obviously, they will sell more units of those products that they promote in the end caps.
Traffic and exposition time
The sincere question is: which are the most successful products to obtain the overall performance? E.g., if you place tennis balls in the main aisle of the supermarket, you will sell them quickly for sure. The practical question is: are tennis ball the product that will give me the highest revenue? Or there is any other product that will convert faster (more people will take it when they see it) and with better margins.
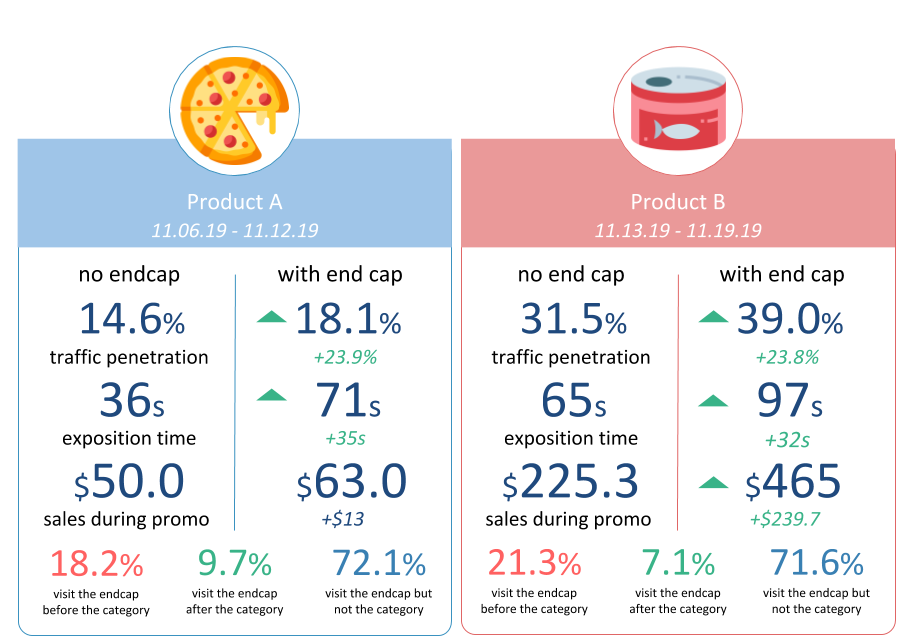
two products displayed in the same end cap
This is an example of two different promotions in the same end cap. Let’s call them Product A and Product B. The first of them didn’t make a significant increase in sales during the promotional period. Therefore, the performance cannot be good as they had been losing possible revenue for two weeks over the wrong allocation of precious space in-store.
On the other hand, the second product has made an increase in traffic and sales during the promotional period. This was very good news. Not only was there a noticeable increase in customer shopping times but we saw an increase in traffic, and sales.
Up to this point, everyone will agree that Product B is our winner and it should be promoted much more frequently than Product A. However, let’s examine two other products and their results.
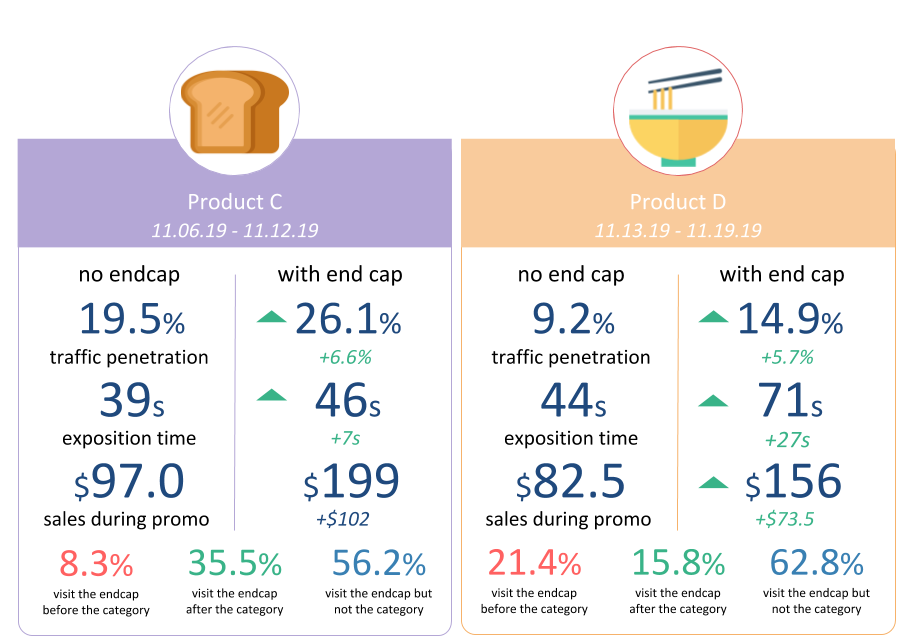
two products displayed in the same end cap in a retail store
In this second scenario, results have changed substantially. Product C has performed, in a first look, a better performance than Product D. In the next section we will analyze why this event yields different conclusions than the previous case.
The end cap conversion
We can then compare the first scenario, Products A and B and see that the former product did perform poorly compared to the later product, which increased overall traffic, sales, and awareness.
Hence the conclusion is fairly simple to make, one should definitely go for products such as Product A in the store and avoid Product B when possible in those particular locations.
Product A could however still be profitable if renovated and placed in a different location. Hence our analysis of the footprint was able to do just this. Based on our cross-correlation matrix, introduced in a previous article called Cross-Selling Analytics: discovering the correlation matrix, We suggested the most correlated end caps to the original category of the product to place them.
For Product B’s campaign, we also suggest some improvements in line with the data we had obtained. For example, we found a poor correlation with Product C so a fourth Product D can be introduced that has a higher cross-correlation factor and therefore increase the overall performance.
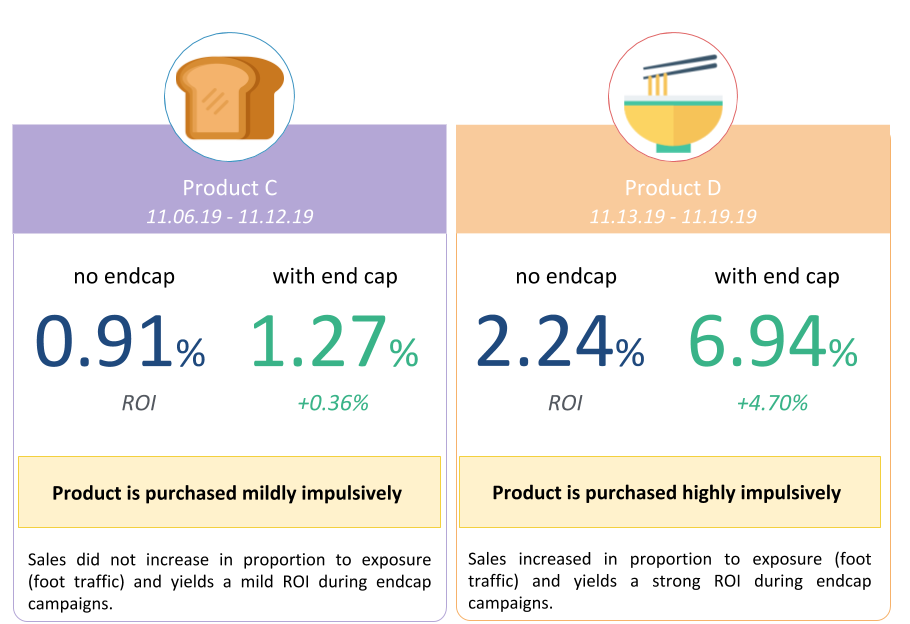
Traffic that originated the transactions is crucial to understand the performance.
Looking at Products C compared to Product D, sales are higher and overall traffic is higher. However, Product D has returned a higher increase in sales for a lower amount of traffic. That means the conversion rate is higher in Product D. This is a crucial insight, as the conversion takes into account not only sales but also the foot traffic that generated these transactions.
Conclusions
At the end of the day, only one question matters. How relevant are these analytics for the category, sales, and operational managers?
The answer to this is fairly straightforward. For these managers to be able to make strategic decisions for new merchandise, offers, and sales strategies, accurate and concise information and analysis is a priority.
Our solutions don’t just measure sales but also conversion rates at each end cap. Hence maximizing profit for each. It gives these managers the tools they need to make quick and effective decisions. That in itself is invaluable. Thanks to Shoppermotion, you can apply Business Intelligence to your end caps in any retail store.