Your store is a dynamic ecosystem that works together to produce a profit. For this to happen, there are key factors that need to be balanced out. Customers need to be exposed to your products and the impulsive nature we humans exhibit from time to time needs to be taken into account. In this post, the end caps are analyzed using retail intelligence.
From the moment a customer walks into the store to the moment they leave, every aspect of their interaction is an indication of their intent, decision-making process, and overall mission. This means that as a retailer, you need to focus on every aspect of your customer interaction. This includes what they see, where they see it, how they navigate through your store, plus how their shopping mission is executed.
All this information is used to determine what the shoppers’ behavior over time will be which is then used to create better content for our end caps. We partnered with a major US grocery chain to see exactly how proper analysis of their customer behavior could be used to increase efficiency and sales. We found that with the data in hand, plus adaptation of a strategy based on the results, there was an increase in both their customer experience and sales volumes.
Remember, each retail location is different and may be subjected to different rules. Shoppers might behave differently from store to store. What doesn’t change however is the need to analyze behavioral patterns for each location. The simple act of matching what customers see at each end cap, for example, with their shopping mission, led our retail partner to experience quantitative growth. This post explains the importance of analysing the end caps in retail intelligence.
Data and Business Intelligence
The first step in any analysis is to gather data. This involves us taking a look at what the customer behavior is from the moment they come into the store. Our system does this non-intrusively. Once we have the raw data, it’s time to convert it into useful information. We take that information and merge it into proper strategies through adaptive Business Intelligence tools.
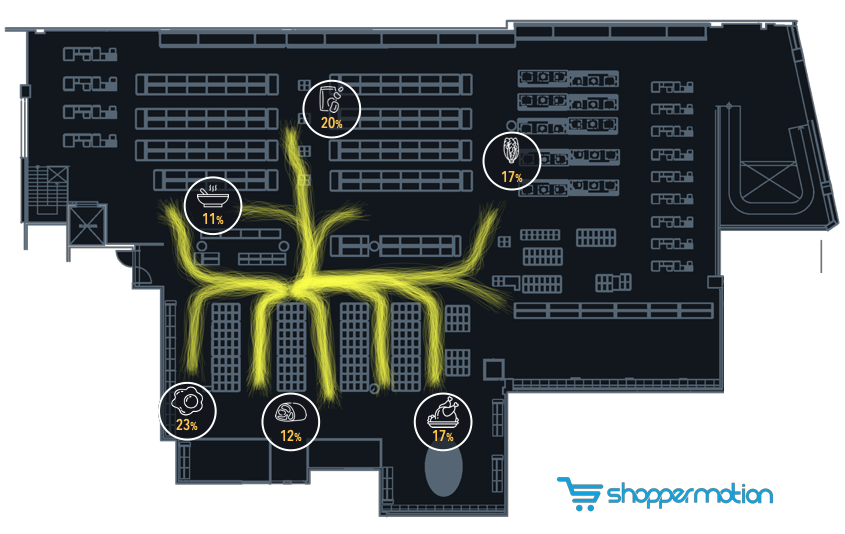
The data can indicate which end caps are most visited, which need to be worked on and what duration the item shown at these points is viewed. Both store and operational managers can then take this information and enhance each of the various end caps within the store and optimize them for better yield.
End caps and KPIs in Retail Intelligence
Next is to figure out our KPI on each of these end caps. The data generated at each end cap can be broken down into a few KPI groups, most of them are found in e-commerce analytics solutions like Google Analytics. The first set of KPI’s we looked at was time-related.
They include:
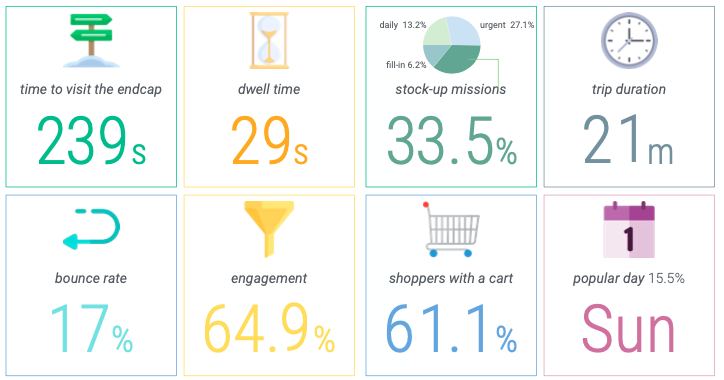
- Time to visit the end cap: This is a measure of how long does it take for each customer to reach an end cap during their visit.
- Dwell time in front of the end cap: Here we measure the duration a customer spends inspecting the content displayed at the end cap.
These KPIs help us understand how impulsive is the product in the end cap (how long does the customer stay next to the end cap defines how easy is for the customer to take the product). From this information, we can glean even more data.
- Bounce rate: This is the percentage of shoppers that stay less than 5 seconds next to the end cap.
- Engagement: Whereas here we are looking for the percentage of shoppers that stay more than 10 seconds next to the end cap.
These last two KPIs help us understand the attractiveness of the merchandising, help us improve its store location, aspect, and offers. Basically, the more time spent by more individuals at a certain end cap, the more meaningful that end cap is.
Our analysis also takes into account other factors that affect the end caps at a given location at varying times.
These include:
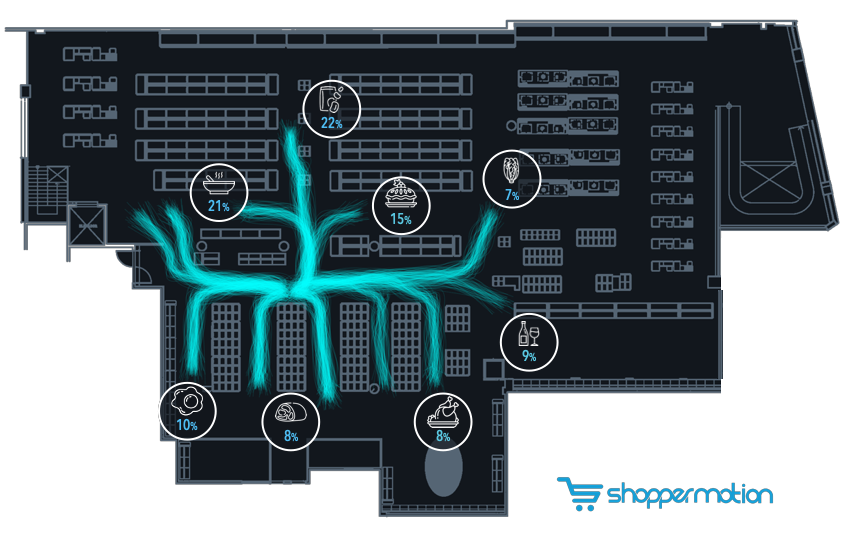
- Origin or Destination: Knowing where the shoppers come from before reaching our end cap provides information about which products should be promoted in each end cap and order.
- Shopping mission: Which type of shoppers are stopping by my end cap defines the type of merchandising that I should place here. For instance, if stock-up missions, that are long and usually with large shopping carts, are popular in one end cap, it is recommended to place products related to this behavior (detergent, canned goods or home cleaning)
- Trip duration: How long do trips passing near the end cap last on average. Useful to understand if we are willing to present products to “busy” people or more inspirational people browsing for new recipes and ideas.
- Cart vs. basket: Percentage of shoppers using one specific shopping tool. Quite useful to choose if we should place merchandising of big/heavy formats (cereals, large coca-cola bottles, etc. ) or smaller (tuna cans, sandwiches or chocolate bars) if the popular shopping tools in the end cap are hand baskets.
- Popular day of the week: Useful to synchronize promotions with testing or in-store activations.
Other transactional KPIs such as the store end caps conversion and ROI will be addressed in a future post.
Conclusions
Having this wealth of information, the client retailer was able to create viable strategies for increasing the relevance of the end caps using retail intelligence. This also was key in making decisions on placement on new merchandise. Store managers can go further my implementing offers at key locations, devise more adaptive sale strategies and make decisions that enhance the sale of a product or brand as required.
The guess-work and old “best practices” are taken out of the equation with actual empirical data. This information also happens to be available in real-time. So, as the situation changes, the retailer or store manager is able to change and modify strategies accordingly.