Having access to an analytic tool and making full use of it can sometimes be two very different things. In our previous post, we talked about in-store analytics and why they are needed. But now we are going to look at a practical application of just how in-store analytics can enhance the shopping experience and allow stores to gain the maximum benefits and effectiveness from their flyers and promotions
When we talk about in-store analytics, there are many things we can pay attention to and different direction levels to approach, but when it comes to actual in-store promotions, this task usually falls to the marketing managers. From budgeting to planning to execution, all these are within their preview. Hence these are the folks we will be focusing on today.
In this post, we will review just how our analytic tools can be of help to marketing managers in making the most of in-store promotions to get maximal results from them.
How to calculate the performance of the flyer
We start off with a relatively simple concept – the promotional flyer – common in almost every store and a great tool to let the shopper know about current sales and items on discount. Plus it gets the shopper focused on the items within the store that you would like to draw attention too.
When calculating the effectiveness of flyers or promotions, a marketing manager has to take a lot of things into account. In order to help them have a clearer view of their budget investments, we will analyze a promotional flyer that is currently being circulated by the store. Note that this is just one of many approaches, but it is very visual, so it will help us understand both the functioning of promotions and in-store analytics.
Let’s start off by giving a general overview of what a promotional flyer is. It is usually produced as a single printed sheet that announces special promotions regarding specific products.
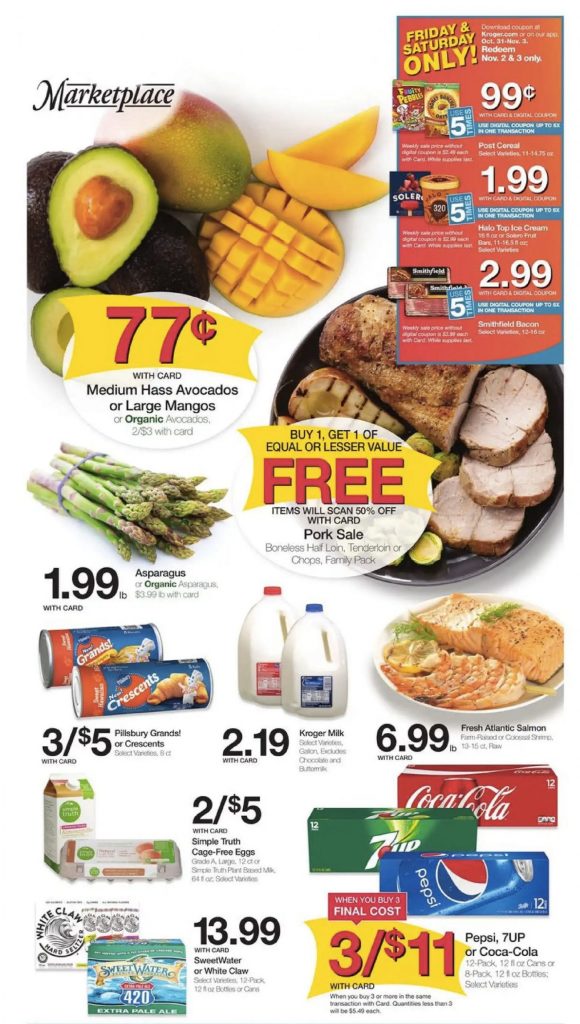
Probably, among marketing managers, it is one of the most used tools as it is both basic and economical. Since it has a short lifespan, supermarkets and grocery chains usually use cheap materials (such as lightweight paper) to keep the cost as low as possible. Besides, the size and format have been standardized.
Usually, marketing managers only get to see the effectiveness of their promotions and flyers by taking a look at the sales numbers at the end of a promotional cycle. With this combined analysis, they can see in-store behavior focusing on specific products together with the sales.
In order to do so, we will analyze the impact of the promotion in terms of penetration and ROI.
Analysis of the CSDs
These are the KPIs collected for the CSD example, let’s review them one by one.
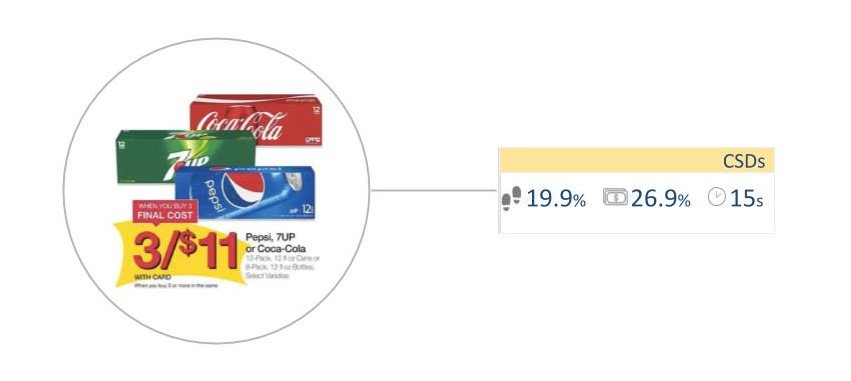
- Traffic (19.9%).- Percentage of total visitors who have interacted with the section. This metric is measured by our token-based analytics. As we described in a previous post, the tokens are installed on the available shopping tools which broadcast their position in real-time, hence collecting the complete journey of each customer in the supermarket. If our supermarket has received 5,000 visits during the promotion, and we have had a 19.9% traffic in the CSDs section, this means that 995 clients have passed by it.
- ROI (26.9%).- Percentage of customers who have passed by our category who have made a purchase. Thanks to the purchases during the promotion, we know that 268 clients have bought CSDs. Besides, our traffic percentage shows that the category has received 995 visits. Therefore, if we divide the number of purchases by the total number of visitors to the category, we get our 26.9% ROI for this specific product.
- Average time (15s).– The average time customers spend in a specific section. Once again, with the information collected with our tokens, we can measure this metric. In the case of CSDs, consumers have spent 15s.
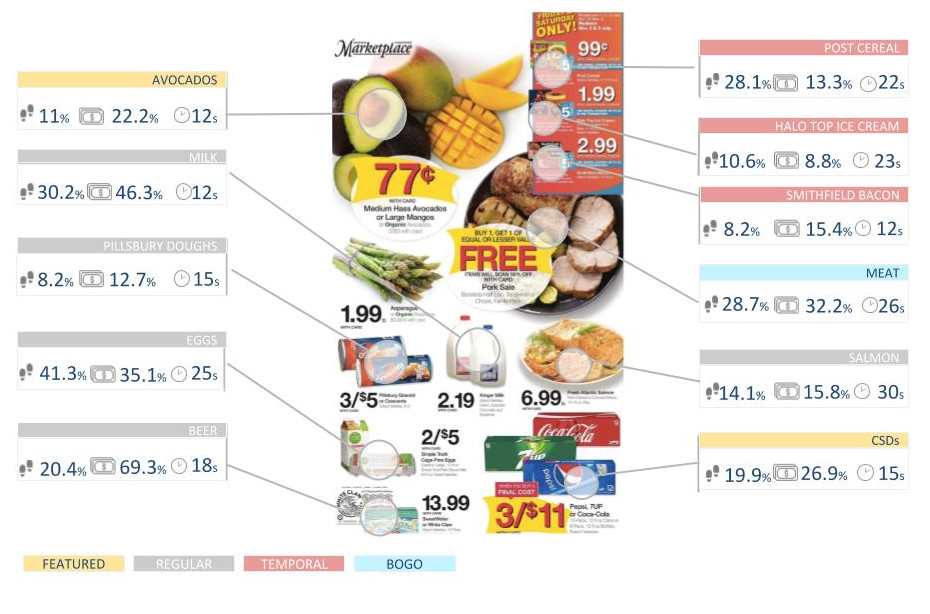
In the following image, the rest of the products’ KPIs are displayed:
Promotion flyers’ performance analysis
Once the promotion has been launched, it is also important that we analyze some additional metrics.
[table id=7 /]
This chart shows the average metrics for products from each category. The average ROI and dwell time refer to the data shown in the promotional flyer. Then we have three new metrics or indicators, which are going to help us improve the ways we allow our customers to interact with the products during their journey at the supermarket:
Engagement Rate
This, in simple terms, is the percentage of people who spend more than 15s in a category. We have to look carefully at our numbers since a high rate is not always a good indicator. This might mean that people spend a lot of time in a specific section either because they do not understand the product or because they lack information about it. On the other hand, a low rate shows a lack of interest. In order to verify if our rate is high or low, we should do benchmarking with similar stores, formats, or regions so as to compare percentages. You can find more information about the engagement in our glossary.
Bounce rate
Here we look at the percentage of people who spend less than 10s in a category. A high rate means that the product does not attract people’s attention or that it is a basic and well-known product that people usually buy. An example of the second case could be CSDs: people already know which brand they prefer, so if they want to buy coke, they spend little time in the section just picking up the product. You can find more information about bounce rates in our glossary.
Engaged dwell time
Finally, we assert the average time people spend in the section once they are engaged with it, which means that they spend more than 15s. Once again, if we have a high rate it could mean that people do not understand the product. In any case, we should take into account that people spend more time with fresh products such as meat or fish since they look at different aspects (expiration date, appearance, package weight, etc.). Therefore, for these products, the average time should be high.
Conclusions
Our analytic tools do more than just present final sales numbers but show an in-depth image of the shopping process and how positions like that of the marketing managers can make creative use of the data. We can obtain valuable metrics to show our clients with creative applications.
This time, we focused on how the analysis in the study is valuable for the role of marketing manager since our data helps them understand the behavior of customers during promotions. But it doesn’t end here, there are multiple applications to our metrics that can help different direction levels within a supermarket or grocery chain.
We know sales are important and most stores only care about the final sales numbers, but we should not forget that the customer journey gives us precise information about what is really happening in our supermarket. But sometimes finishing the right path for expansion and an increase in sales volumes can’t be done without having a deeper understanding of how your customers interact with your store.
Hence, at this point, in-store analytics come into play. A marketing manager will only assess the impact of the promotion by taking a look at the sales, but penetration and ROI show us how the customer is really interacting with a specific section. Therefore, the combination of these metrics will help them make better in-store decisions in the future and track the effectiveness of flyers and in-store promotions.
In the next post, we will review different actions that can be made in order to improve their performance using the conversion funnel.