The traditional purpose of in-store marketing is evolving with the constant digitalization of the point of sale. Typically in-store marketing performance has been measured by looking at profits before and after activity. If the sales figures bump up, the promotional material is considered a success. However, this field is still considered a black box despite the fact that in-store marketing has significantly risen in the last years according to Cadent Consulting Group. With all the inconveniences and scalability issues this involves, most of the measurements and observations are performed manually. In this post, we will explain how to improve in-store marketing with customer flow.
Old-fashioned manual tracking
As a general rule, if a manufacturer wants to study the reaction of shoppers at the point of sale, a research company will visit the store for a few hours. With a great deal of patience, a group of consultants will follow random visitors and illustrate their journeys thoroughly on a piece of paper. Once they reach a headcount of around a hundred people, they will sit down and convert that raw data into information.
With a great deal of patience, a group of consultants will follow random visitors and illustrate their journeys thoroughly on a piece of paper.
The difficulties concern two questions: scalability and representativeness of the sample. The former involves a huge problem as the data collection relies on personal criteria and an extraordinary number of man-hours. The latter cannot be overlooked; data is the new source of knowledge and computers demand large amounts of samples, so they can create mathematical sequences that adjust to all possible patterns and situations. It is highly probable that a few hundreds of shoppers do not represent enough scenarios to make a country-level decision.
Measuring the performance of in-store campaigns
The most delicate part of launching a new promotion is to choose the right product and an appropriate discount for that campaign. Although the latter requires a rigorous decision-making process, margins, previous commercial relationships with the retailer, and any historical records help companies decide a proper price point. However, regarding the selection of the article, manufacturers — represented by local agents or merchandisers — come up with multiple unknowns. Manufacturers pick between three to five products of the same category to test, such as a shampoo with different aromas, or an instant noodle soup with various flavors.
Once they have chosen both variables, the promotion is generally launched as a trial within a few stores during a period of two or three weeks. The following Figure contains an example of different promotions and their sales within each period (margins are considered similar for all the products, and hence their profits).
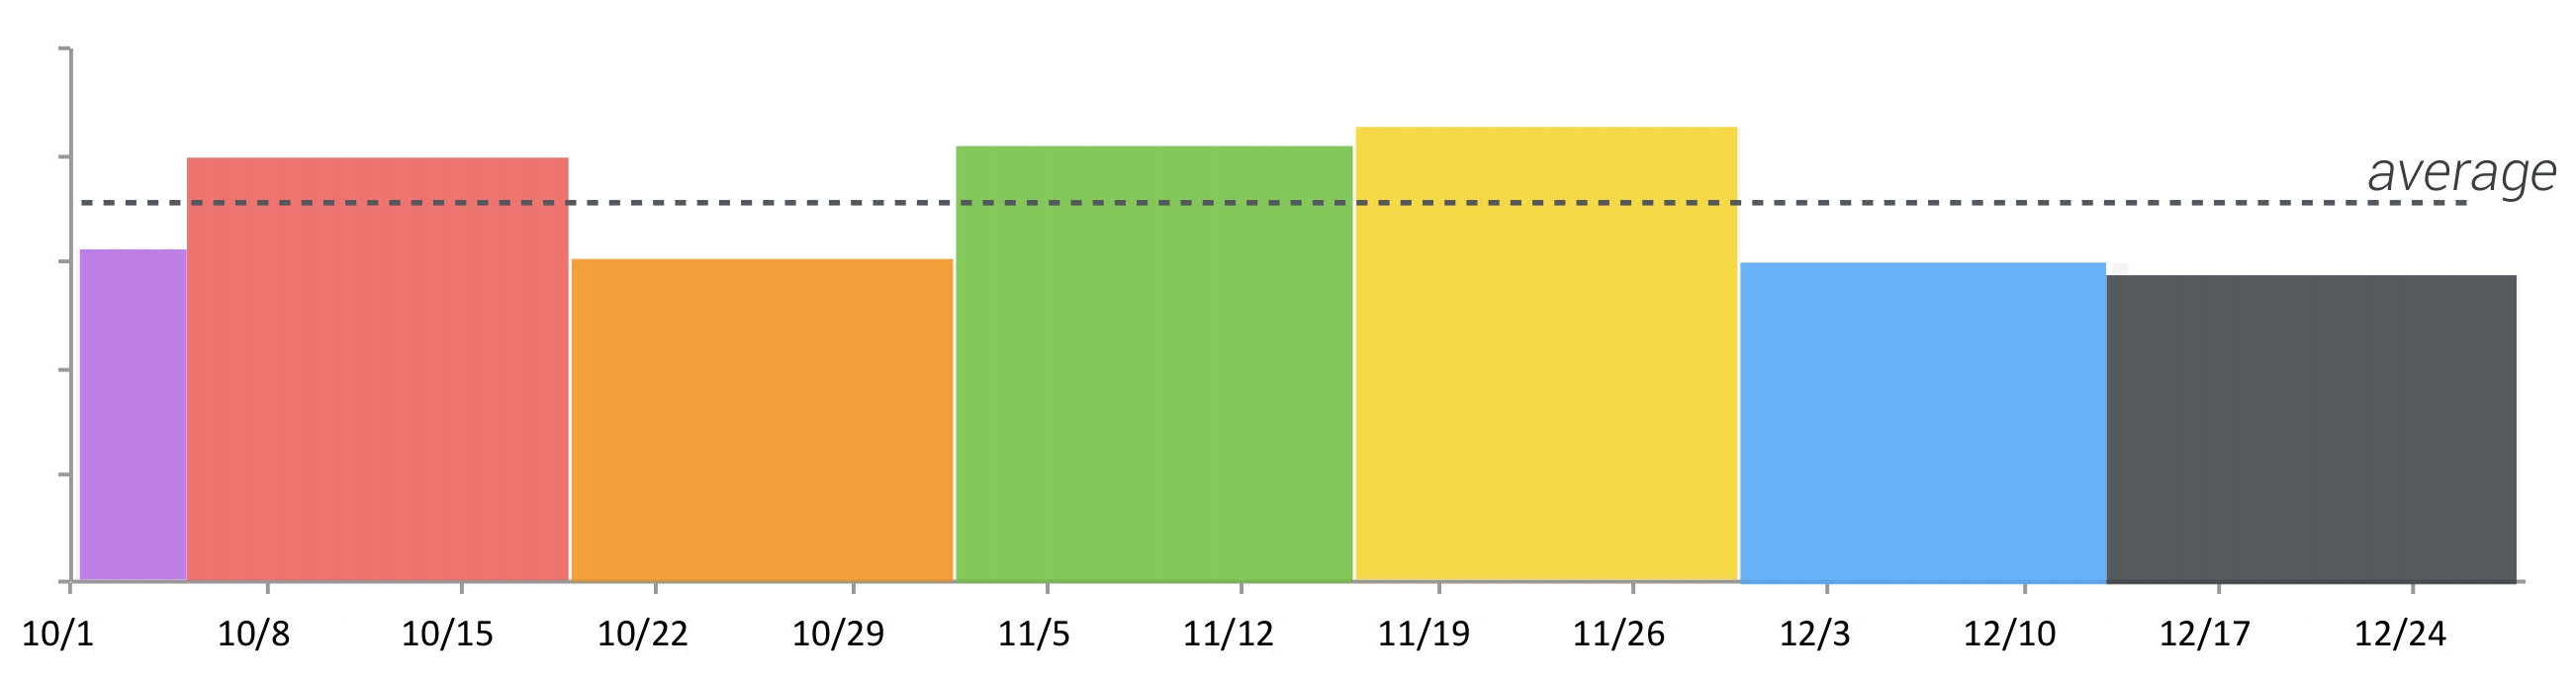
Once the campaigns have finished, the manufacturer will compare the total sales and pick up the one which reported greater sales. Following our example, the yellow campaign (November 15th to December 1st) was the most profitable. Nonetheless, this decision may not be entirely accurate. It presupposes that any other factor regarding the promotions remains constant, which is unlikely to happen as shown in the upcoming section.
One step further into digitalization
With the aid of technologies such as Shoppermotion, the digitalization of brick-and-mortars has encouraged retailers and manufacturers to implement new solutions to collect larger samples at a lower cost. Nowadays, manufacturers obtain information directly from the stores and use this data to elaborate continuous analysis of their categories, promotions, and campaigns.
The output of this analysis is not simply restricted to the visualization of the journeys and customer flow, but also to an effective collection of analysis, conclusions, references, and insights extracted right from the data. The application of big data algorithms such as unsupervised clusterization or forecasting techniques addresses complex problems by means of intelligence reports.
With this in mind, the impact of in-store campaigns can be measured in a different way. If the retailer offers non-transactional data from their visitors, merchandisers could not only consider the sales but also many other variables such as dwell time in front of their promotion, origin, and destination of their visitors to the category, engagement or stopping power and strength their arguments when choosing which promotion to scale nationally. Therefore, we will improve our in-store marketing with customer flow.
In the preceding example, the yellow promotion was picked as the sales were higher than any other promotion in the same interval of time. This time, the analysis will include the foot traffic in front of the promotion to the study. This will determine if the top seller’s promo is also the one that attracts more traffic. The following Figure contains the foot traffic next to the promotional area during the same period of time.
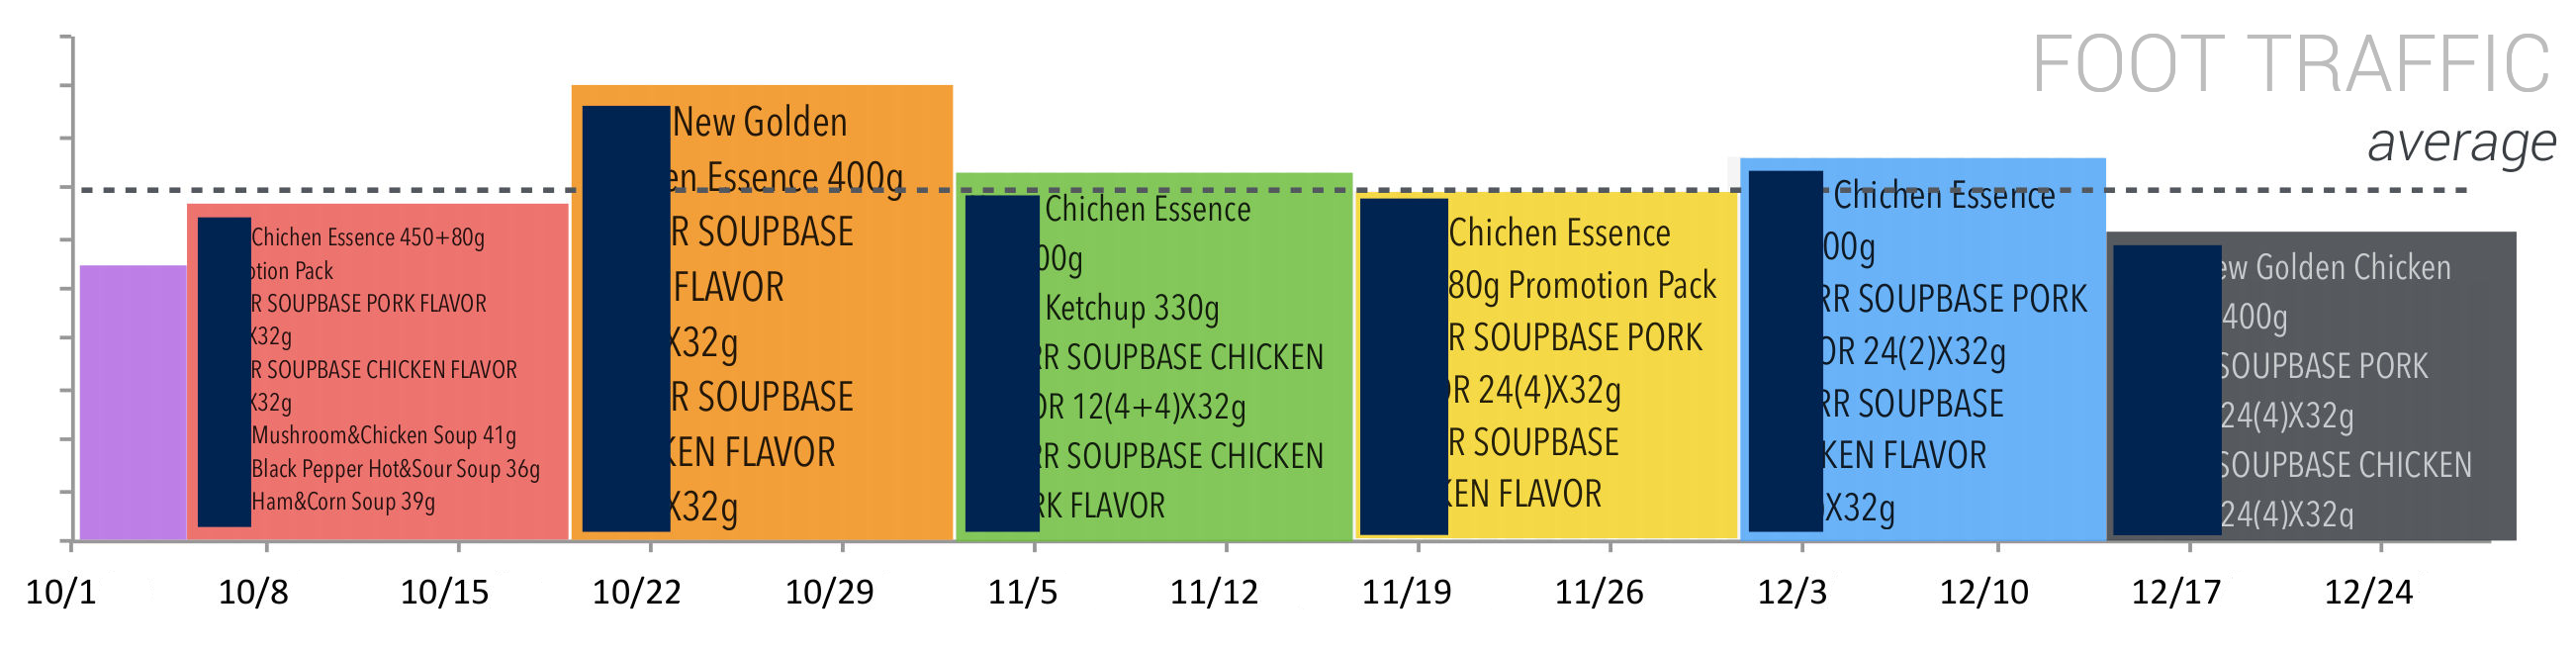
As expected, the most successful promotion attracted a considerable number of shoppers nearby. Thus, the yellow promo may still be considered a good choice to scale. However, there are additional results coming from this graph.
The red promotion, with lower customer flow attracted, has been able to convert near the same amount of sales as the yellow one. Although it was considered a second alternative when looking at economics, it has performed much more in terms of sales per foot traffic. Hence, the return on investment for this promotion is undoubtedly higher than the former and makes this promotion much more lucrative. The selection of the red campaign instead of the yellow was estimated at a 15.8% increase in sales with respect to the original plan.
Preventing underperformance campaigns
The previous study becomes valuable not only in its ability to distinguish the most prosperous promotion but also to determine which ones are underperforming. In this study, orange and blue promotions must be urgently reviewed by the manufacturer. Although they brought a significant amount of shoppers around, most of them declined to grab the item.
There are many reasons why this can happen: poor communication, lack of added value, or a wrong flavor or taste. The following chart collects the ROI for each campaign and a brief description of its execution.
[table id=4 /]
Conclusions
Successful in-store marketing events require preparation and they should always be data-driven. Manufacturers should consider their objectives early and make a list of expectations in terms of sales, engagement, product placement, and representative stores for each category. Also, account executives should make some general research to identify previous cases and outcomes. This report is an example of how to improve in-store marketing with customer flow.
Although it’s difficult to digitalize the point of sale, adequate planning and testing using in-store intelligence measuring customer flow can result in better execution and more efficient use of time and in-store marketing expenses.