It is undeniable that the job of a Category Manager is essential for the correct functioning of a grocery store. Our goal in this post is to support Category Management with fresh ideas and trends so that they have all the information needed when designing strategies for 2021 with the ultimate target of increasing their sales.
Category Managers design product placement so that everything seems appealing during our visit to the store, but their duties do not end up here. They also contribute to the profitability of the company by fostering sales via marketing and in-store promotions and they manage everything related to product inventory, either they order new items or try to improve the speed of inventory turnover. Today, we will cover the most successful trend to boost sales this year, including:
- Analysis of the sections’ traffic
- Performance of local flyers and promotions
- Shopping missions
- Measurement of the power hours
- The study of the correlation matrix
- ROI Analysis
- Conversion funnel
The importance of understanding our customers’ behavior
Let’s say that the report is addressed to the Category Manager of the dairy and cheese products section of a well-known supermarket. The category has not achieved the expected results during the last semester of the year after the COVID-19 breakthrough, so changes need to be made to face a better 2021.
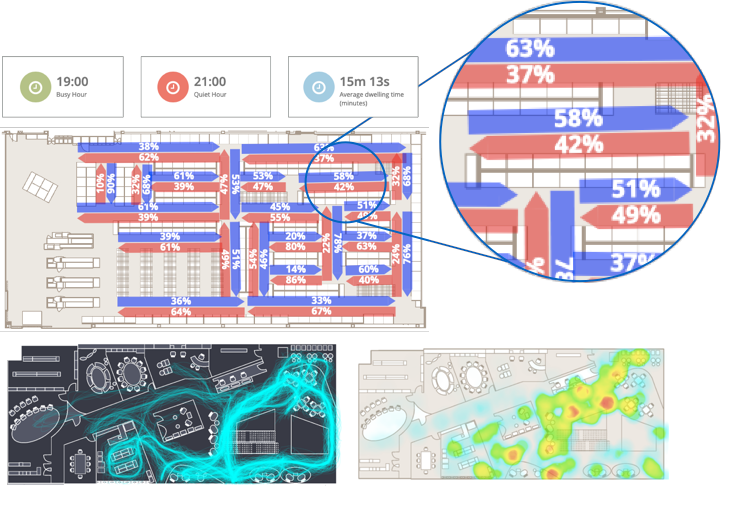 Several examples of customer behavior analysis in-store: busy and quiet hours, average visit duration, aisles direction, flowmaps, and traffic heatmaps.
The first thing here is to analyze the information about the category to understand what is happening and how the shopper is interacting with it. Thanks to our token-based technology, we collect complete shopping journeys in a passive and anonymous way. Then this transforms into metrics that let us know how customers behave around the different categories. By crossing all this information we can prepare a thorough report that includes different analytics in order to help Category Managers with the decision-making process. In the following sections, we will review all the analytics they can take advantage of.
Section’s traffic
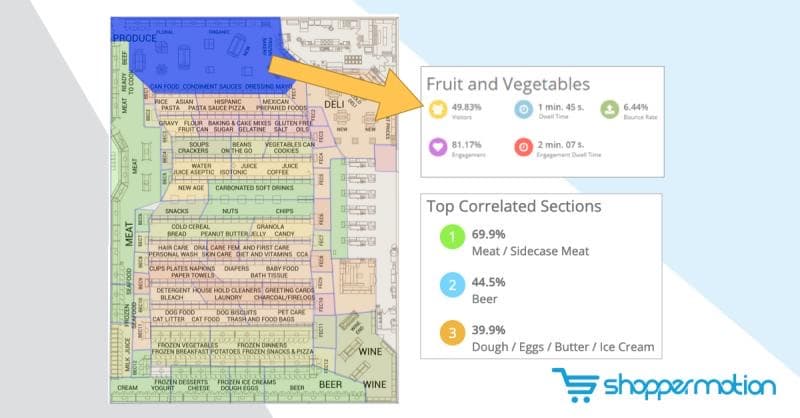
The first thing a member of the Category Management team should consider is the traffic related to their sales received by the category. They have information about the tickets, so they can know how many customers have purchased a product from the category. On the other hand, we can obtain the percentage of visitors who have interacted with the section, so all this information lets them know the exact traffic their section is receiving.
Taking into account that Category Managers have endless decisions to make, they rely on different sources to obtain information about market trends (consumer panels, manufacturer’s numbers, internal data, etc.). This is essential for them in order to do benchmarking since they can compare the situation of their category in relation to their competitors and assess if their performance is low on average.
Another figure related to traffic is the average time spent. But careful! We will have to do benchmarking once again to see if dwell times are within the normal range. And keep in mind that different products have different dwell times (find out more about it in this post).
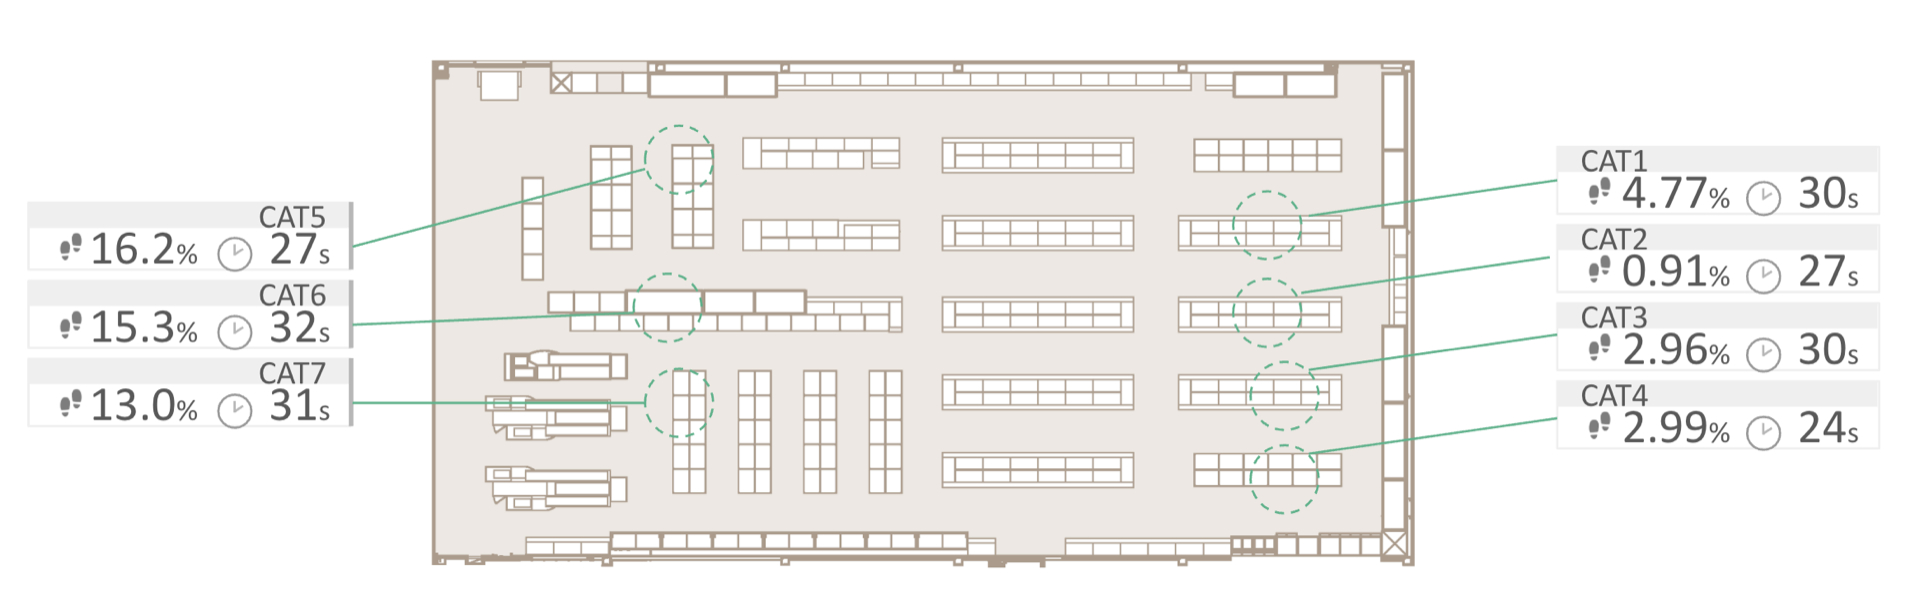 Example of an extract from a report detailing category’s traffic and dwell time
Local Promotions
Thanks to all the information examined in this post, Category Managers are able to know what is going on in their categories in order to make informed decisions. But this is not the only application of these metrics. When mixing all of them, they let us analyze specific actions or tasks of our job as a whole.
For instance, if a member of the Category Management team would like to measure the effectiveness of a local promotion (i.e. promotional flyers), we can develop a report analyzing the performance of each product by means of these metrics and relate them to the sales. In a previous post, we showed what an analysis like this would look like. This image shows the recap of the products analyzed in the aforementioned post.
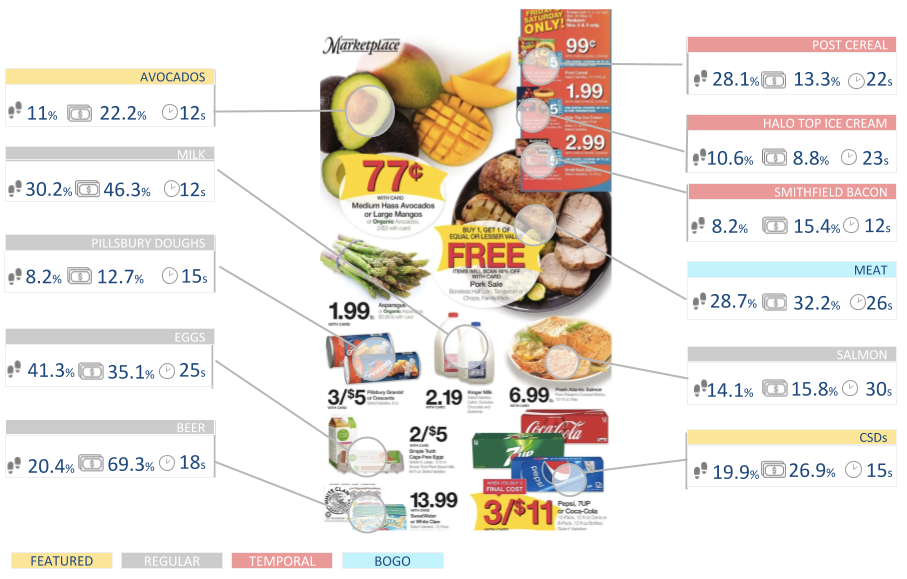 KPIs for products from a promotional flyer
Shopping missions
All shoppers have an objective when visiting a grocery store, and thanks to shopping missions we can cluster shopping journeys in order to identify which is the main purpose of customers’ visits. By analyzing different aspects such as the categories visited, the hour of the day, or the shopping tool used, we can classify shopping journeys into four types of shopping missions: fill-in, stock-up, urgent item, and daily shop. For a Category Manager, this information can become very useful when trying to understand which is the predominant type of customer that visits their category in order to adapt strategies to their specific needs.
For instance, if we identify that most of the customers that visit our category are conducting daily shops, in other words, that they come to the store to visit certain categories with a focus on fresh and perishable items, it would be a good idea to place other fresh products in my category to foster their sales. On the contrary, if I see that my customers visit mainly the store because they need something urgent, I could place small format products that they can grab quickly and effortlessly.
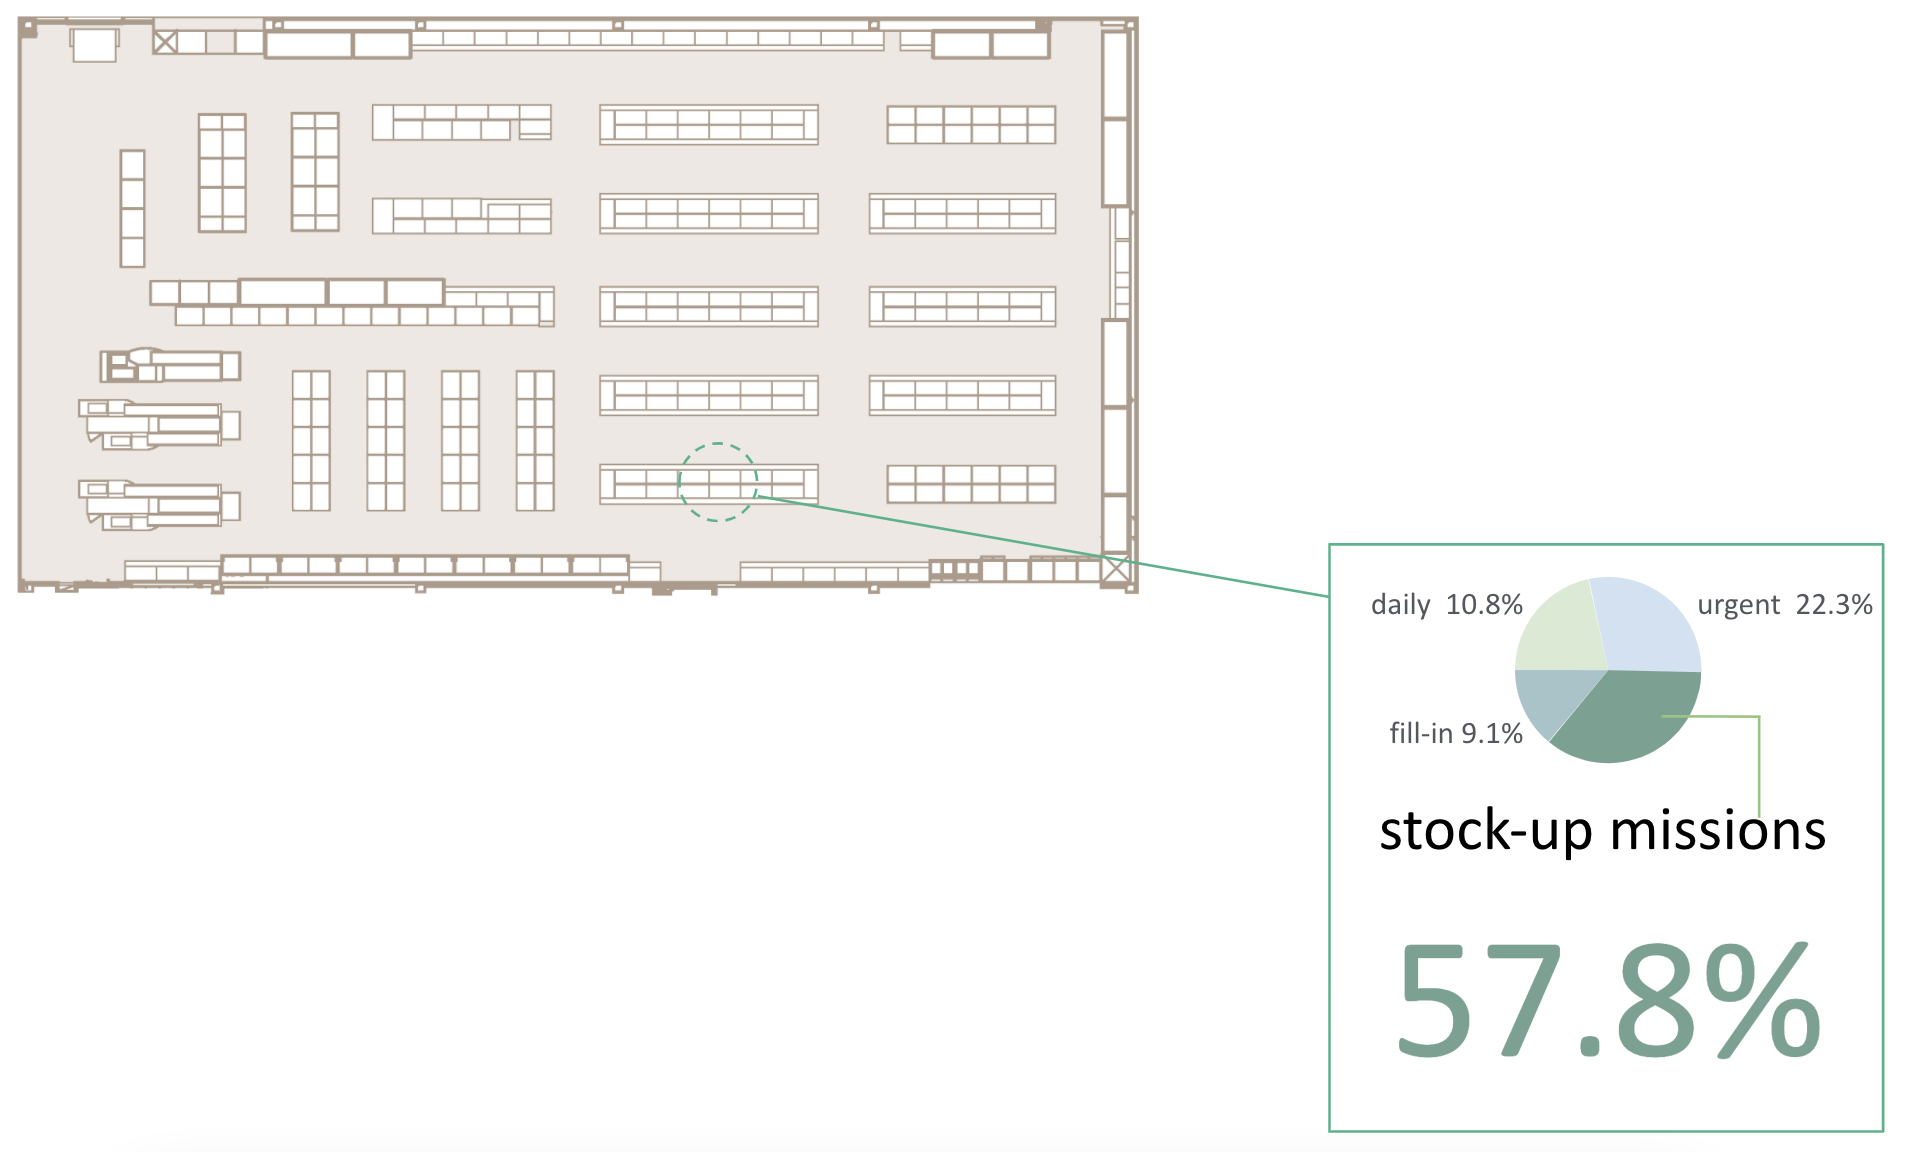 Example of the shopping missions’ distribution for the dairy and cheese section
Another interesting thing we can extract from this metric is the distribution of shopping missions during a week for the whole store. If we have previously identified the predominant shopping mission for our category, knowing when this type of customers visit the store can help us recognize the best days to launch promotions.
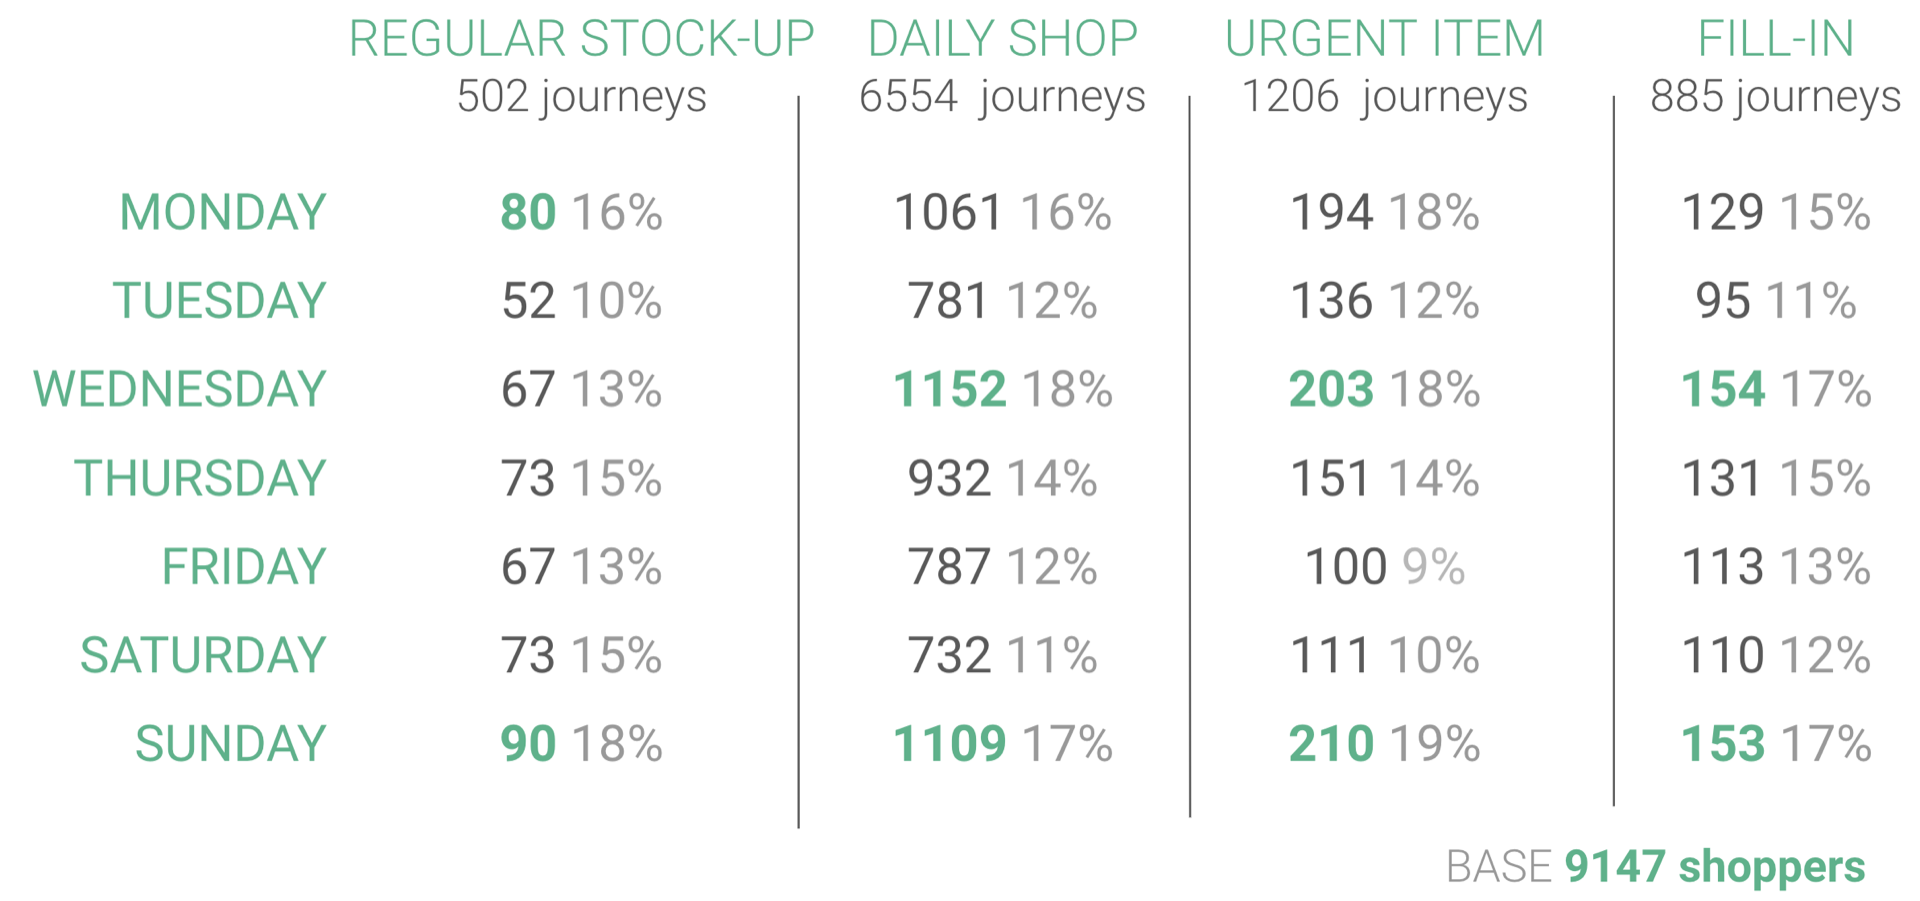 Distribution of shopping missions during a week
According to the previous example, I know that my category is mainly visited by people who go shopping for stock-up missions. When taking a look at the distribution during a week, we can identify that people who do regular stock-ups visit stores mainly on Mondays and Sundays. Therefore, it would be interesting to develop some kind of in-store activation during these days to attract the attention of my target audience. Stock-up missions take place when customers visit a wide variety of sections in bulk to be able to fill the refrigerator for the upcoming weeks. Therefore, customers will be more willing to take advantage of a 3×2 promotion or a pack that comes with an extra free item since they are going to buy a large number of products to fill their pantries.
Power hours
If, as part of the category management team, we want to launch a promotion to foster the sales of certain products, the power hours metric will become very useful. Thanks to it we can identify which are the busiest hours and days of the week. Since the objective of launching a promotion is to have as much impact as possible, knowing this information will be very useful when deciding the date.
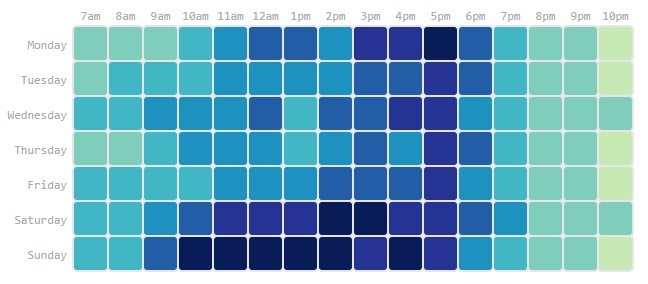 Example of the power hours metric from a supermarket
As we can see in this example, this store is busy on weekends and on weekdays after 2pm, so launching a promotion taking this into account will help us achieve the expected results in terms of effectiveness.
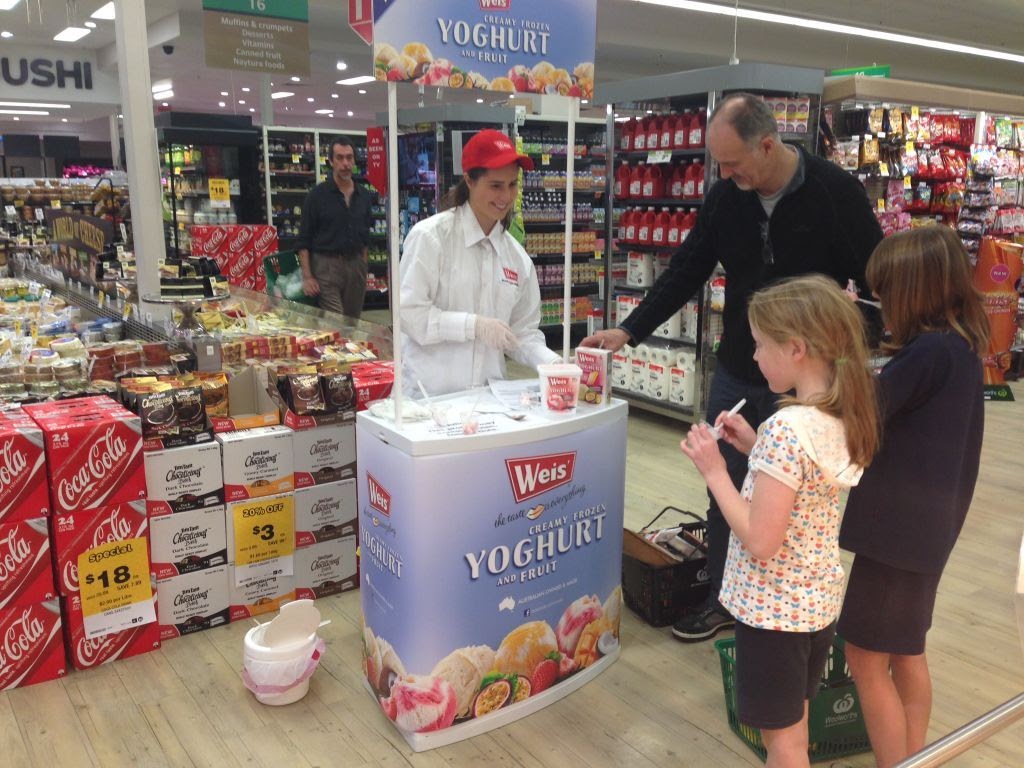 Example of an in-store pop-up display
Correlation matrix
Another important thing to take into account is the interaction of customers with the different categories. A metric that comes in handy when analyzing this is the correlation matrix, which shows the probability of a shopper stopping at a certain category assuming that he has stopped at any other section of the store (take a look at this post to learn more). Thanks to this we will be able to identify the inbound and outbound traffic, that is to say, those categories that were visited before going to the specific section and after. With this information, Category Managers will have enough data to develop cross-selling strategies.
For example, we have identified that there is a strong correlation between cheese and wine, as people like to organize soirées with friends. Therefore, it could be interesting to place a display with wine or related products in the dairy and cheese category. Thanks to this, people will grab something from the display or visit the wine section after, so we will be fostering the sales of these related goods. Other products that are highly correlated are snacks and drinks, so placing a secondary touchpoint of snacks between both categories will be a good cross-selling strategy.
ROI analysis and sales in Category Management
Without a doubt, the ROI is one of the most useful indicators when analyzing the performance of a category, so it will help us understand a lot of what is going on. This indicator shows the percentage of customers who have passed by the category who have made a purchase.
Let’s say that our supermarket has received 2103 visits during a week and 36.75% of shoppers have visited the dairy and cheese section (773 customers). If we know that 428 customers have purchased at least one product from this category, that means this category has a 55.3% ROI.
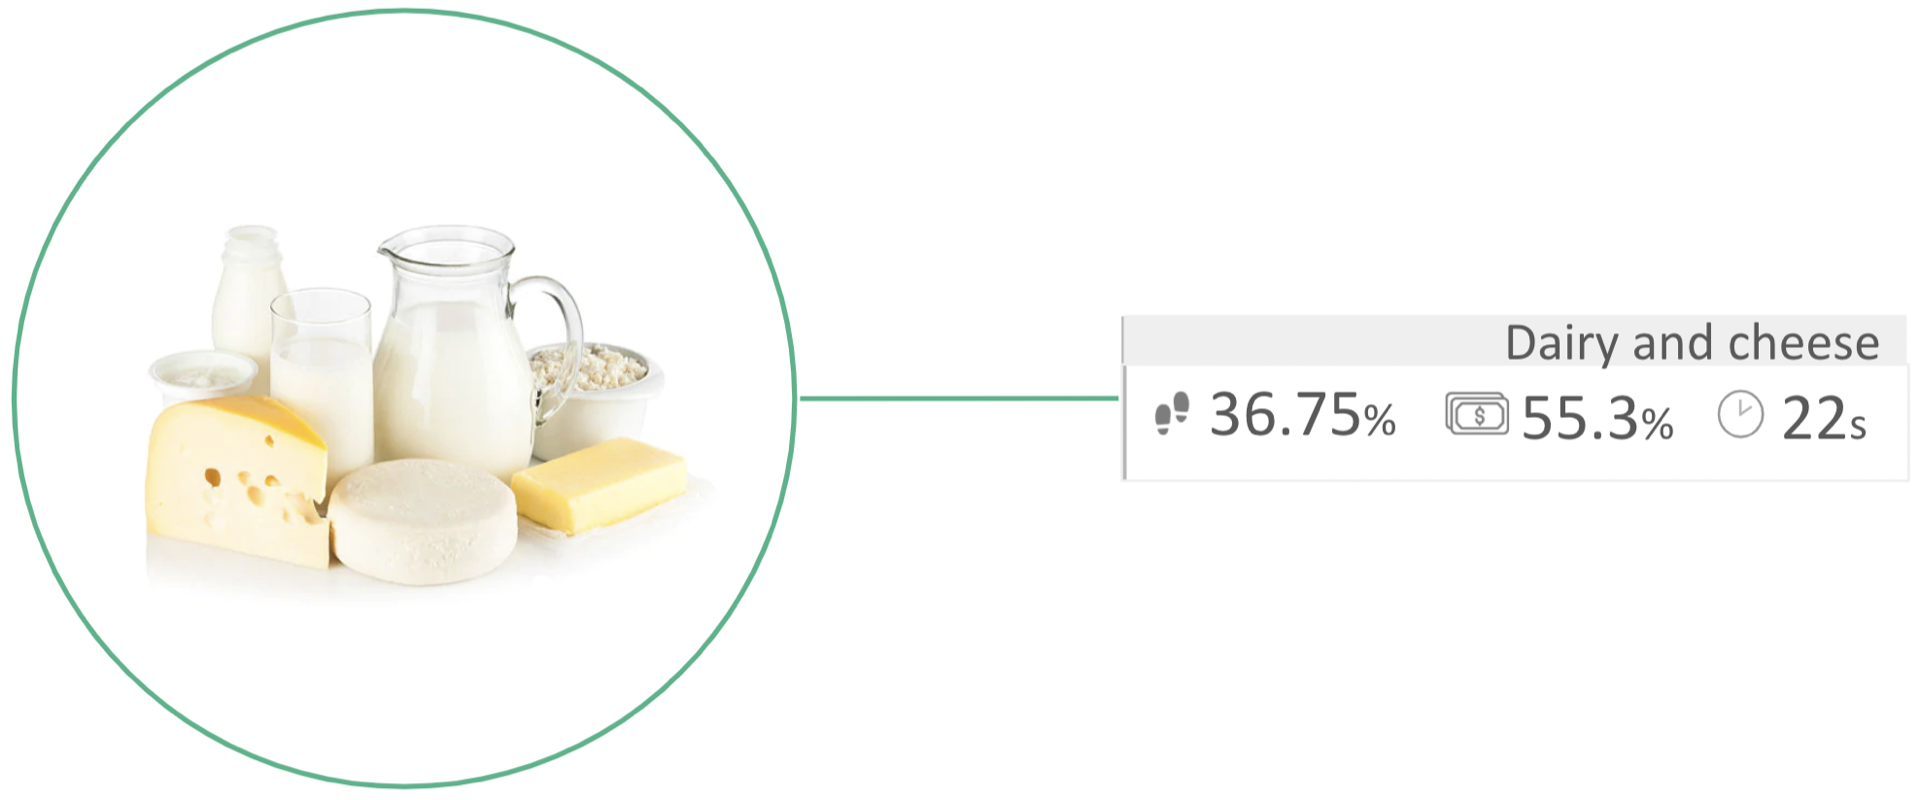 Insights for the dairy and cheese section (traffic, conversion rate and dwell time)
I guess you will be aware by now that benchmarking is top when analyzing numbers. Therefore, once calculated the ROI, CatMans will have to compare their figures with market trends to estimate if their category is underperforming or obtaining results above average. By doing this, they will be able to assess if they need to launch more promotions in order to improve the total sales of the category, since the more traffic received, the more chances to sell a higher number of products.
Conversion funnel
Finally, the last step is to understand the process by which visitors become buyers. Plus, identifying each step of the funnel will let us recognize as well at what stage potential customers are losing interest in our product. Thanks to this we will be able to make better decisions and improve the conversion rate. In a classic funnel, we encounter the following steps:
- Penetration. The traffic received by the section
- Bounce. Percentage of people who have spent less than 10s in the category
- Browsers. Percentage of people who have spent between 10 and 15s
- Engaged. Percentage of people who have spent more than 15s
- Conversion rate. Percentage of visitors to the grocery store who have purchased a product
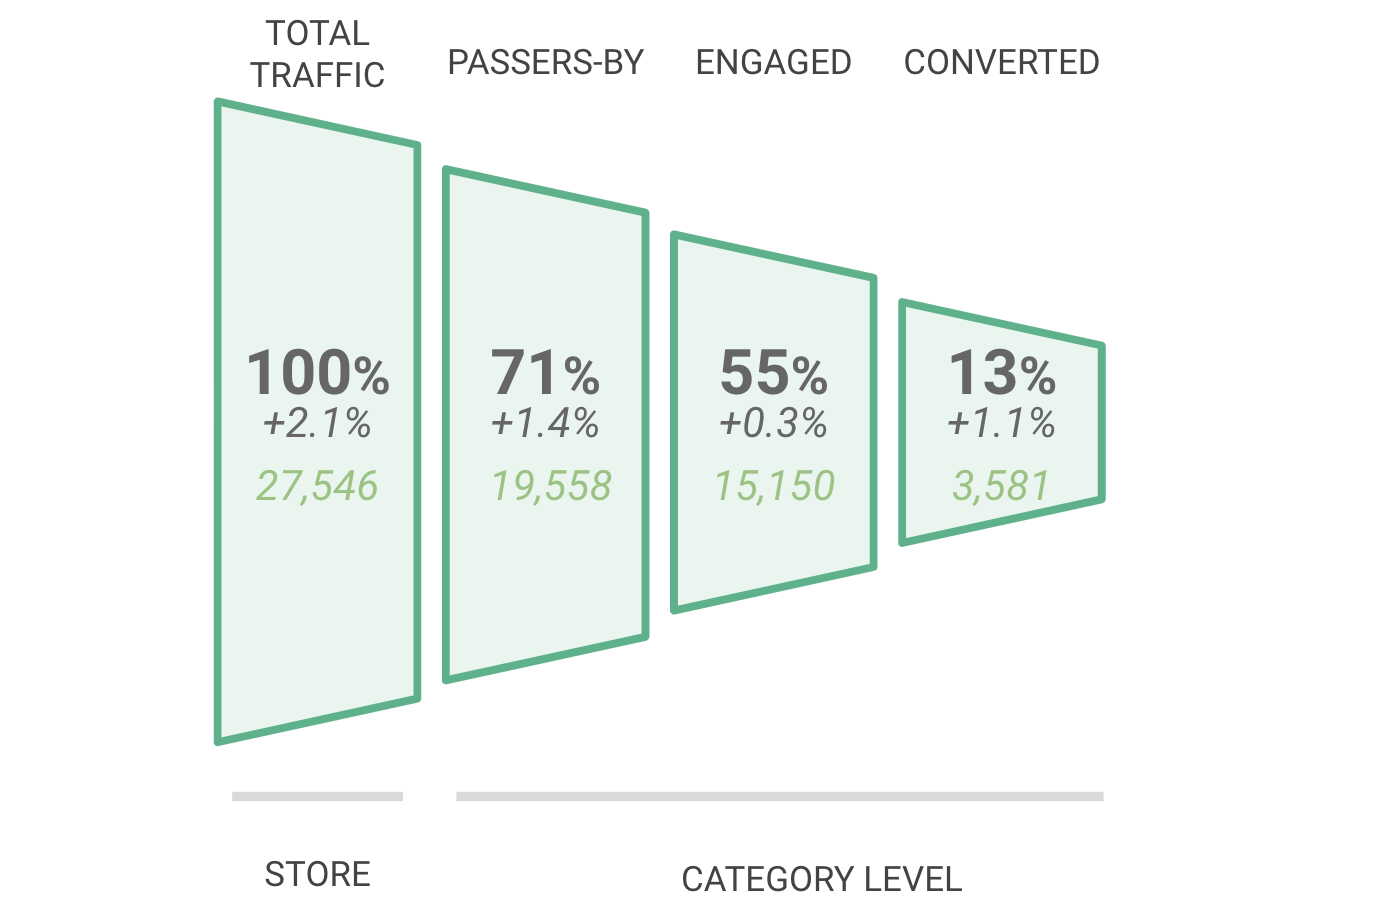 Steps of a conversion funnel in a category
If you’d like to see a complete example of the conversion funnel and possible actions to implement at each step, read how grocery retailers calculate their conversion funnel.
Conclusion
At the end of the day, Category Management is really the one who ensures the correct functioning of a store and keeps the sales up. From designing planograms to managing inventories and planning marketing campaigns, these people’s duties cover a wide variety of activities belonging to different departments.
Thus, this is why they need real data about shopper behavior within their categories in order to make informed decisions. At Shoppermotion, we want to facilitate their job, so thanks to our in-store analytics, we can present them thorough reports including all kinds of information they need to take into account when managing their categories in a more effective way.
Each analysis in this post maps to a solution you can use today: section traffic and layout tests in Perfect Store, shopping missions and category benchmarks in Shopper Insights, promotion ROI in ROI & Ad Attribution, and the correlation matrix and missed conversions in Retargeting & Cross-selling. To size a project, see how pricing works or estimate the ROI for your stores.