Items within a store do not exist within a vacuum. There are correlations both subtle and overt between various products within a section but also between their placement, reach, and visibility. Understanding these dynamics is essential for any section manager to make effective decisions.
But in order to capture both the subtle and overt correlation between products in each section, we must first be able to track them. After which we can convert this raw data into meaningful information that gives a breakdown of what exactly is happening within a given section.
Products correlations
This is where we come in. Thanks to our technology we can extract valuable information about the performance of the different categories. We simplify all that raw data into different subsets.
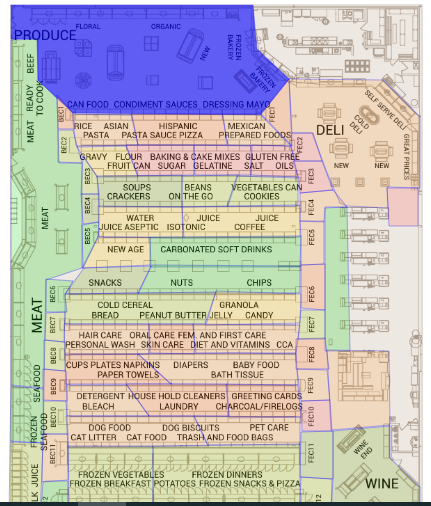
Let’s take a grocery store that utilizes our system as a simple case study. For convenience let’s call it “Jay’s Grocery store”. You have your fresh fruits and vegetable sections, your meat and poultry sections, and the various other things you would expect to find in a normal grocery store. If we analyze the Fruit and Vegetable section, we will find the following information:
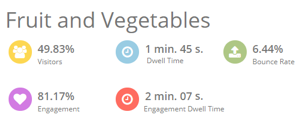
- Visitors. 49.83% of total visitors have passed by this section within a given time frame (usually a business day).
- Dwell time. This is the average time visitors spend in the section, starting from the moment they enter the section until they exit it. In the case of the Fruit and Vegetable section, customers spend 1 min. 45s. interacting with the category.
- Bounce rate. This is the percentage of visitors who have spent less than a certain time (normally 10 seconds) in the section. The image above tells us that 6.44% of customers have had no interaction with the Fruit and Vegetable section.
- Engagement. Percentage of visitors who have stayed more than a certain time in the section. This, however, comes with a caveat. We must bear in mind that this duration is highly dependent on the type of business and customers. For example, the engagement for customers at a grocery store would be lower than that for a furniture store. This is because shoppers spend less time deciding what food to buy, whereas furniture shopping requires a long decision-making process with customers usually coming back repeatedly to view a particular piece before making a choice. Given that in the example we are talking about the Fruit and Vegetable section of a grocery store, the engagement rate shows that 81.17% of the customers have spent more than 10s interacting with the section.
- Engagement dwell time. This is the average time visitors spend in the section once they have been engaged. In simple terms, the time starts when a visitor interacts with a product within the section until they move on. This can be triggered by them pausing at certain points or picking up items. For our example, the engagement dwell time is 2 min. 07s.
In addition to this data, we can obtain information about the top correlated sections, which are those that are usually visited during the same shopping journey. Thanks to this, we will be able to see the bigger picture of the section. As you would expect from a grocery store, some items are more popular than others depending on the season, but to find out how each section interact and relate to each other is where the analytics comes in.
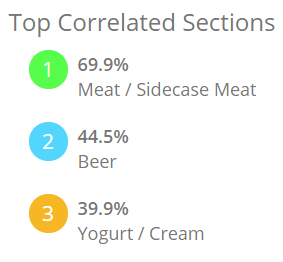
Following our previous example, we have selected the Fruit and Vegetable category to obtain the metrics related to this section. If we take a look at the top correlated sections, we will see that 69.9% of customers who visited the Fruit and Vegetable section took a trip over to the meat category also, all within the same shopping journey. In the case of beer, 44.5% of customers visited this section as well, and 39.9% of total visitors spent a considerable time at the yogurt/cream section.
For any category manager, this is critical information. Not only will they be able to launch effective cross-promotions, but also manage their categories according to shoppers’ insights. It’s a simple concept. If I know that the more time visitors spend in my category, the more money they will spend, I will try to attract their attention and make them spend as much time as possible.
All this information is gathered thanks to the correlation matrix. This is important because it measures the probability of a shopper stopping at a certain category assuming that they already stopped at any other section of the store. If you can predict where next a shopper will go based on where they have been, you can make adequate preparations and increase sales.
Application of products correlations to facilitate in-store targeting activities
Now let’s take this a step further and talk about how to take advantage of this. In e-commerce, there is a strategy called retargeting, by which retailers try to attract the attention of their bounced traffic. Knowing where your customer is likely to go next is critical for this to work.
A way to adapt retargeting to brick and mortar could be to launch cross-selling strategies. Let’s take an example of a product such as beer. In order to get cross-selling to work a few simple steps might include:
- Placement of beers in strategic points throughout the store. If I want people to buy beer, I need to attract the customer’s attention in other points rather than the beer category.
- Let’s say that thanks to the correlation matrix I know for sure that people who visit the beer category visit as well the snacks section → cross-selling: in the beer section I can place an endcap or a chips promotion panel.
Conclusions
Any competent category manager understands the importance of having the right information at the right time. The same goes for store managers and category managers too. But in order to make proper decisions, this information must be presented in such a way that it’s easy to understand and allows for quick implementation of desired strategies. The matrices and analytical data our solutions present goes directly to the heart of the problem and allows managers to see exactly what they need to do and when to do it.
This helps to know what cross-selling products would go well together based on their correlations, what retargeting strategy to use, and how to adjust each section to maximize customer engagement and sales.