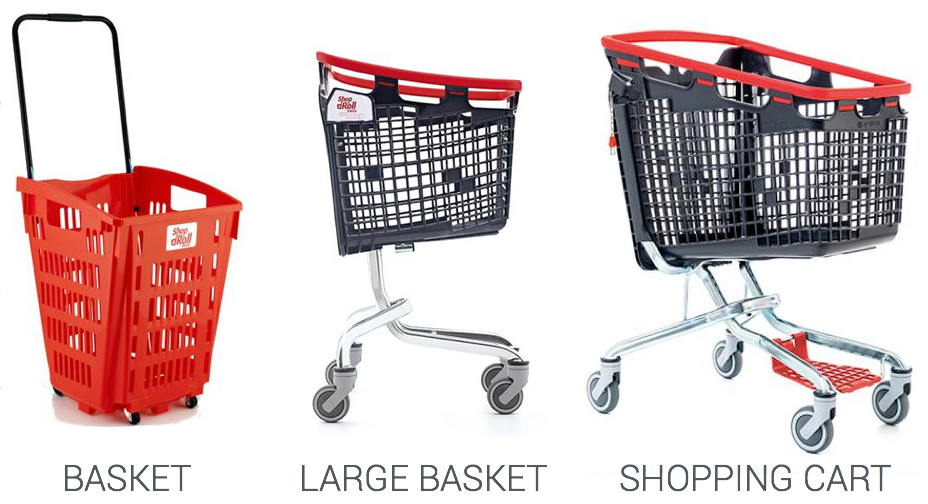
One of the very first things a shopper does when entering a store is to pick up a trolley, also known as shopping carts, or a basket before starting their journeys down the various aisles and sections. These are what we are referring to when we mention shopping tools. Devices used to collect products for purchase at a supermarket or grocery store. In this post we will cover the hidden insights that we can extract from the usage of the shopping tools.
Shopping baskets seem to have come into being the same time as stores and markets but the shopping cart/trolley was first introduced on June 4, 1937, the invention of Sylvan Goldman, owner of the Humpty Dumpty supermarket chain in Oklahoma. Since then their introduction, they have become a prominent fixture in every supermarket and grocery store worldwide.
The use of these shopping tools has become so integral to the purchase experience, that they have now given us a deeper insight into customer behaviors simply be examining what shopping tools are picked on entry and the journey they undertake while in-store.
Now with more detailed analytic tools, stores and retailers are able to collect, anonymously and passively, this data on the journey made by thousands of customers while shopping. This information then helps them see the important the various shopping tools are at varying times and in varying quantities.
13,973 customer flows have been collected in this study in a group of grocery stores with a footprint between 1,000 and 2,000 sqm.
Also, this study will assist store managers to discover which shopping tool between baskets, large baskets and shopping carts adapts better to their business.
To understand this, a case study, for an average store, is broken down into three critical factors:
- The length of the journey
- The day of the week
- Passes and stops while in-store
Length of the journey
The time spent by shoppers in-store can be longer or shorter depending on the shopping tools picked. This metric will be part of the crucial hidden insights within the shopping tools analysis. In the case of the small baskets, they are usually found in situations where the shopper makes short journeys, with an average of 8.59 categories visited, but also allow for more flexibility so the shopper can engage in medium trips, with a standard deviation of 4.81 categories.
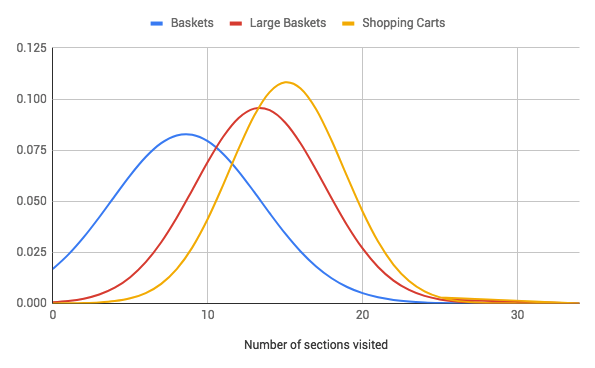
Shopping Carts, however, are more frequent in long journeys as expected. With an average of 15.11 categories visited during the purchase, also have a narrower standard deviation of 3.68, and therefore less flexibility. Shoppers will not choose this tool in short-medium journeys.
Large baskets offer a great equilibrium between covered distance and the requirements for short and long walks.
However, larger baskets are in general more efficient as displayed in the graph. They increase the number of sections passed during the journey (and therefore the average ticket sale, compared to baskets) with an average of 13.35 categories visited per journey and a standard deviation of 4.16 sections. Therefore, the latter offers a great equilibrium between covered distance and the usage expectation of the shopping tool.
Day of the week
Using a metric called Power hours, that measures the traffic per hour of the week, stores are able to gather the various variables or statistics for each shopping tool, with which they can find the max and mins time for each.
Comparing the results in the next Figure, it was found that certain days of the week will see more use of baskets over shopping carts and vice versa for others.
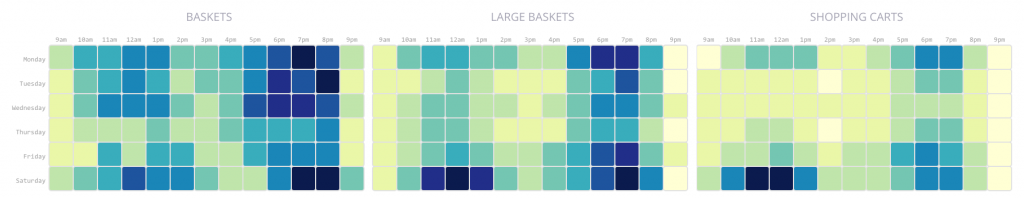
From the Matrix above the following simple conclusions can be drawn:
- Tuesdays and Wednesdays are the days with less traffic, Friday and Saturday mornings are the busiest for all the tools.
- Baskets are widely more used during the whole day range while shopping carts are used mostly on weekends and at the end of the labor days.
- Large baskets are heavily chosen in two blocks every day: mornings between 10am and 1pm and afternoons between 4pm and 8pm.
Passes and stops while in-store
Here, the analytics tool takes into account the number of times shoppers visited a category/aisle, the number of pauses at each of those categories and finally, the number of stops made.

Calculating the average of this data we are left with a table that looks like this:
| Shopping tool | Passed sections less than 30 s. | Paused sections more than 30 s. | Target section more than 2 min. |
| Basket | 9 | 8 | 0.27 |
| Large Basket | 15 | 13 | 0.75 |
| Shopping Cart | 13 | 11 | 0.3 |
With this data, it can be concluded that the conversion rate (target sections) is very similar between baskets and large baskets but the number of covered sections is 30% larger, and therefore the average sale, in the latter. Also, in general, the rate of pass-pause is similar in all the shopping tools. However, the stop rate is much higher in the trolleys and the counts for parked shopping carts, temporally during the purchase, reflects that difference.
Choosing the optimal quantity and type of shopping tools can raise up to 13% the average ticket sale in your stores
So, what does all this mean for a retailer, supermarket or grocery store?
First, shopping carts do more traveling but baskets yield more variance in the length of the journeys. Based on the distribution of the store, one shopping tool should be promoted over others or be available in larger quantities.
Next, the day of the week and time of day should be closely monitored, with the quantity of the desired shopping tools prioritized during peak periods.
And finally, we see that larger baskets travel through more sections and have a higher conversion rate than smaller ones.
Conclusions
When all these are taken together, stores get a deeper insight into how shopping tools and their hidden insights can influence customer behavior. The analytical data can help them make smarter decisions on placement and quantities of these tools. There are many other aspects to be taken into account when managing a store such as the performance of the main aisle of different layouts, the value of retail intelligence for category management or the potential of knowing your clients analyzing their shopping missions.
With the aid of Retail intelligence tools such as Shoppermotion, retailers and manufacturers are now prepared to measure, understand and make accurate decisions in-store.