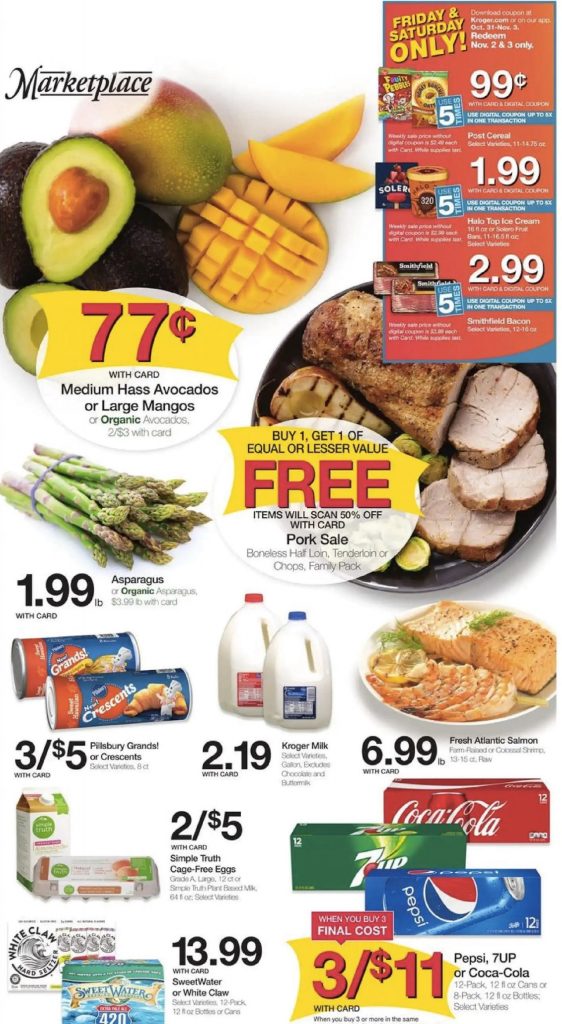
When it comes to getting a promotional campaign right, nothing is more important than having the right information. This is where in-store analytics come into play. Now we are going to take this a step further and learn how to calculate the conversion funnel for grocery retailers of some of the promotions offered in their flyers. Check out our previous article where we explained how to measure their effectiveness within the promotion.
One of the great advantages of our metrics is that they allow us to see the performance of the various products, as well as identify those that are not receiving the attention we expected. Thus, we will review as well some actions marketing managers can implement in each step of the conversion funnel in order to improve the numbers.
It should be noted that when it comes to e-commerce platforms, it is much simpler to analyze the information of incoming customers as there is a higher number of metrics to use. However, with these analytics, we can apply different metrics within physical stores to gain the desired results.
How to calculate the conversion funnel in flyers
Let’s start by taking a closer look at the data gathered from the promotion. It should be noted here that for marketing managers, the conversion funnel is another interesting analysis to take into account in order to see the effectiveness of in-store promotions.
[table id=8 /]
To get a full view of what each section represents we are going to break down each of the metrics:
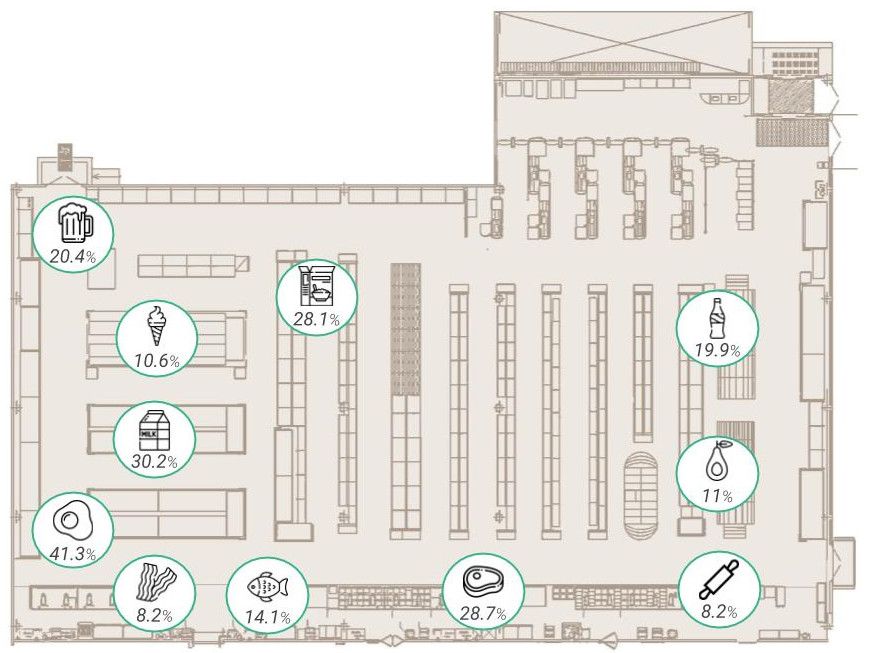
- Penetration.- It refers to the traffic each section has received. This means that if we had 50,000 customers during the promotion, 9,950 have visited the CSDs section. This data is gathered with our in-store technology.
- Bounce.- It shows the percentage of people who have spent less than 10s in a category.
- Browsers.- It shows the percentage of people who have spent between 10 and 15s in a section.
- Engaged.- It shows the percentage of people who have spent more than 15s in a section.
- Conversion rate.- It shows the percentage of visitors to the grocery store who have purchased a specific product. For example, the 3.7% conversion rate for cereals means that from the total visitors we had during the promotion, 1,850 have bought this product.
When taken as a whole, this information shows the process by which visitors to the grocery store end up being buyers of a specific product during their journey. In a nutshell, this is the optimal way to calculate the conversion funnel in grocery retailers.
Analysis of promotions in flyers
Next, let’s take a look at the data of the eggs and the salmon in order to analyze the funnel:
Eggs.- As we can see, this is a product with a high penetration rate. This indicates that most people visit this section during their journey to the supermarket. In the case of the conversion rate, it is high as well, which shows that most people have bought eggs since it is a basic product. If we look at the funnel, we come to the conclusion that from the 50,000 visitors during the promotion, 7,200 of them have ended up buying eggs.
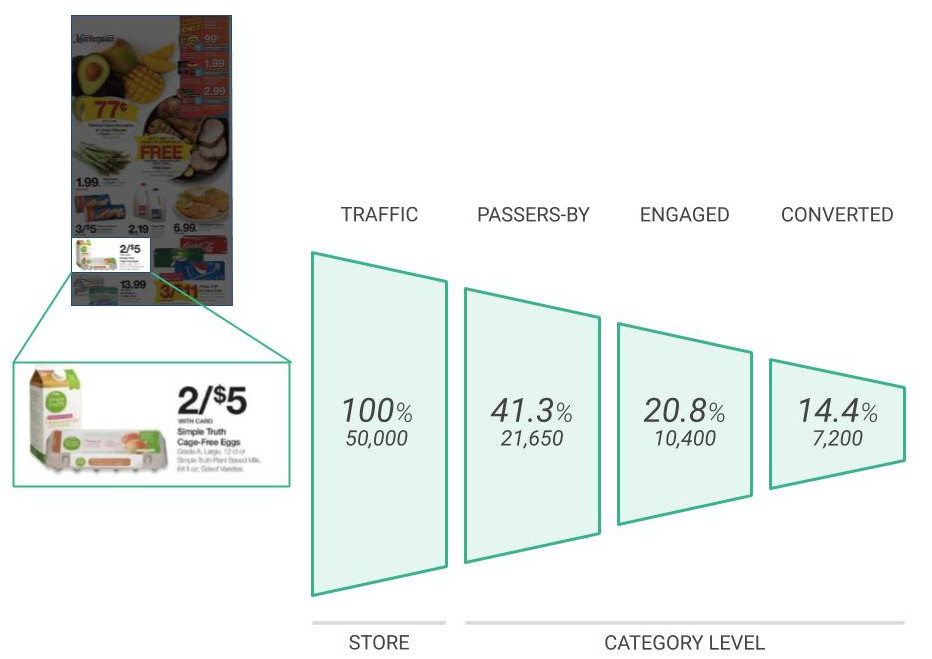
We gain some valuable information from both the bounce and browsers columns. The bounce column shows a high percentage, which means that most people spend less than 10s in the eggs section. This is not a bad indicator, since it means that people already know the brand they like and simply grab the eggs when coming to this section. On the contrary, the browsers column shows that not many people spend between 10 and 15s deciding what eggs to buy.
Salmon.- At first glance, we can see that the penetration percentage is quite low in comparison with that of the eggs. Thanks to this information we can assume that people do not buy salmon on a regular basis. Plus, the conversion rate shows that the percentage of people who finally bought the salmon is quite low – once again an indicator that shows it is not a product people tend to buy. From our total visitors, only 1,100 have bought salmon during the promotion, a figure significantly lower in comparison with the eggs.
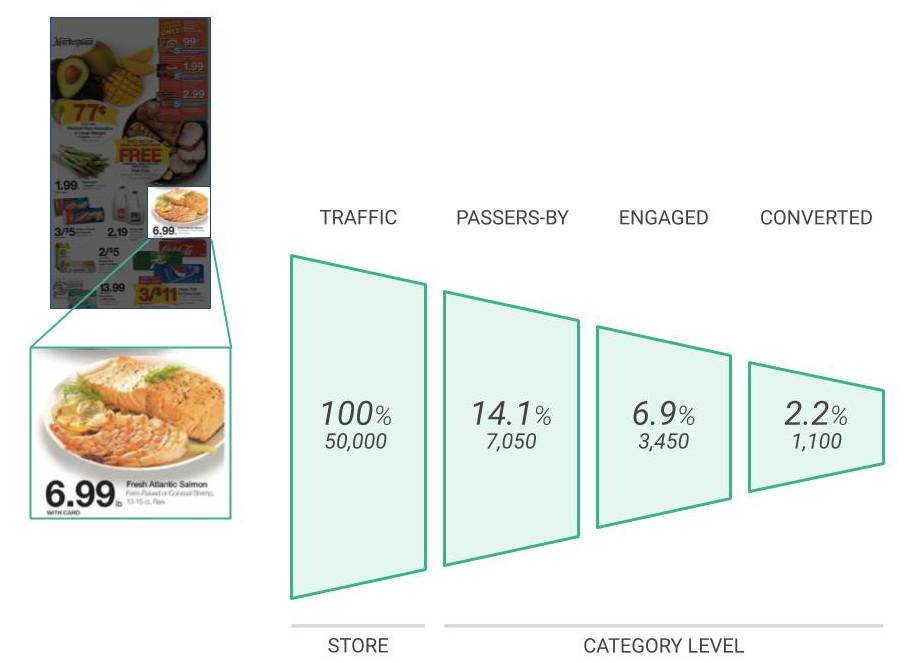
A closer look at the browsers column reveals that there is a high percentage of people who spend between 10 and 15s deciding whether to buy it or not. This usually happens with fresh products, since people tend to base their decisions on different aspects such as expiration date or appearance.
Depending on the product the percentages will vary. This is to be expected as basic products usually have high penetration rates, whilst fresh products or other products more “special” (i.e. ice cream) will have low penetration rates. In both cases, the conversion rate will modify accordingly.
Actions to implement
Broadly speaking, when we calculate the conversion funnel we are identifying how many visitors have become buyers. Therefore, we will now analyze different actions we can implement in each step of the funnel in order to improve the numbers.
[table id=9 /]Once each step has been analyzed, it is important to identify at what stage people are losing interest in our product. It is always advisable to do benchmarking with similar stores in order to see if our funnel and rates coincide for the different categories. If we notice that our numbers are far from the average, we should implement the corresponding actions according to what has been previously explained.
Conclusions
Data is only as important as how it is used and interpreted. But the first step is to actually have the right data in the first place. This is where analytical tools show their worth. Not only do you get data on how each promotion is faring but you gain insight into why each performs the way it does.
This is critical for marketing managers to have in order to make informed decisions. Because they can easily identify which products are performing well and which ones do not meet their expectations. For the latter, there are actions they can implement in order to improve the results. For example, if they feel that customers do not understand a specific product, a solution could be to launch to showcase the various cooking methods. With this, marketing managers will bring clients closer to the product and it could turn into an increase in sales.
In this article, you learned how to calculate the conversion funnel for grocery retailers. If you are ready to take control of your in-store analytics and start making smart decisions on product promotions and general store management, it might be a good idea to get in touch and let us show you what our solutions can do for you.