One of our tools became pretty popular during this calendar year. Almost 70 Clients have already installed Digital Flow. This is our latest tool which is tracking customer journeys, similar to our automated version. However, with the digital flow, the coworker is drawing lines (which equals to the customer pathway) directly on the tablet. The basis is the rough layout of the story or touchpoint, which shows all the aisles, end caps, customer ways, etc. The tool is so easy to use and yet delivers great results. Only now we are celebrating 60.000 flows, being each flow a different customer journey, which our clients have performed. This data helps the retail managers to take appropriate commercial decisions.
Automatic Reports
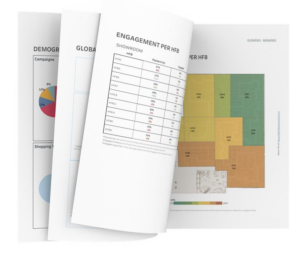
As we are constantly receiving feedback where we are continuing to improve our tools to make them even more attractive for our clients. We are introducing 1-click PDF/PPTX reports which can be downloaded directly from the Digital Flow tool which we believe will become very popular.
Focus area Reports
One example of a future report would be a detailed report about dedicated areas of the store/touchpoint. Imagine you are a Leader in a grocery store and your area of responsibility is all non-alcoholic drinks. You would simply push a button (or we would send it out weekly/monthly) and you would receive a detailed report about your category.
This could include as follows:
- Number of total flows (flow = customer journey) inside your department
- Demographics, % of male, female, families etc
- Share of customer shopping behavior (weekdays vs. weekends, mornings vs. evenings etc.)
- Evolution of traffic incl. comparison vs. previous periods to indicate a trend
- Visit time and duration time
- All events (passed by, touch, engage, buy, ask etc.)
- Conversion funnels (from traffic to passed by to touch to buy) per product/ Range group etc.
- Hotspots vs. Coldspots inkl. Ranking
- Benchmarking against Country/ Global etc.
- And much more
This is in fact a great business intelligence tool and the commercial team or the decision-makers will get instant results. Of course, the more flows the team is performing over a certain period, the more representative the results are. We recommend a minimum of 100 flows per week per section/category.
The results would be outstanding and that would improve the customer shopping experience and at the end of the day, Sales and Profit for the organization.
Reconstructions Reports
Another potential report we will be creating is for reconstructions. Retailers are constantly remodeling their departments, either fully or partially. This report would be created after a rebuild has been completed and it would show a comparison of before and after.
Imagine you are a leader of the sofa department in a furniture store. Together with your partners from interior design, logistics, maintenance, and others you have successfully rebuilt the area over the weekend in order to welcome customers in the new area on a Monday morning.
You have performed 200 flows the week before the rebuild and another 200 flows the week after.
Then you push the bottom and you will receive this report. The report will include certain data and help the leaders from the mentioned departments, when meeting for the handover, to evaluate the rebuild.
Why are we doing these reports?
We’ve built these reports for many reasons, being the most important ones:
- It will save a lot of time: Managers and leaders are very busy so by offering these reports we simply help them. We’ve seen that coworkers spend almost 3000 hours every year preparing the PDFs with the data collected from the customers’ flows
- Insightful results: as we get the info digitally, we can dive much deeper into the results (compare periods, see progressions, correlations, etc.)
- Standardize the information: we’ve seen how hard it is for the managers to understand the information they receive in these studies. Normalizing the studies will simply make their lives easier and they can focus (together with their peers) on taking actions and decisions
This detailed report for a dedicated area is only one example of reports we are going to create and make available to our clients.
KPIs are essential for Retailers
The KPIs which will be included in the report could be as follows:
- Total duration of time customers spend in the area
- Hotspots vs. Coldspots
- Conversion funnels for the range
- Most popular products and take up rate for shopping tools
- demographics , showing who is interested in which part of the area, e.g. % of female being engaged in leather sofas or % of families buying armchairs
- Shopping tool trends and changes
- Correlation with other areas
- Benchmarking with previous re-builds
Summary
Digital Flows as one solution to track customer journeys throughout the store/ touchpoint are very insightful and deliver amazing results for the leader. The new reports we are going to make available soon will help the leader to save a lot of time and be much more efficient. They will receive detailed reports for dedicated topics which they could take as a basis for decision making.