Having the right information is essential when it comes to planning and decision-making in our stores. Relying on sales figures can be a starting point when making important decisions in our stores, but analyzing our customers from another angle will give us more valuable information. If we put them at the center of our strategy, we will be satisfying their needs in a more precise way, therefore improving customer loyalty. Today we will focus on traffic analysis and how to take advantage of two important metrics: power hours and best windows.
If you have read some of our posts, you will be familiar with the technology we use in Shoppermotion. On the contrary, if you are joining us for the first time, you should know that we work with a token-based technology that lets us obtain the complete shopping journeys of customers in a passive and anonymous way (if you want more information about this, you should read this post). Once we obtain this information, we analyze it in order to identify trends within stores. In other words, thanks to traffic we can forecast behavioral patterns within stores so that we can adapt our strategies to customers’ needs.
In order to obtain enriched data when it comes to traffic analysis, we have developed two important metrics: power hours and best windows.
Power hours, a good indicator for traffic
Thanks to this metric it is possible to measure the number of devices at the store at a specific moment. By measuring this, we are able to know how traffic distributes throughout the day and week. For store managers, it is essential to make an analysis of traffic distribution since their mission is to supervise the correct functioning of the store. Hence, forecasting busy hours lets them make effective decisions in terms of:
- Stock replenishment: if I identify that customers mainly visit my store between 1 and 2 pm, I would want to make sure that all categories are replenished before customers arrive at my store.
- Personnel management: once again, if I identify peak hours, I would make sure that there are enough associates to assist customers during their shopping journeys, as well as enough open checkouts.
- Store management: it is important as well to identify off-peak hours so that associates can develop other tasks (i.e. cleaning) when traffic is low.
- In-store activations management: identifying how traffic distributes all over the week will give us a hint on how to design promotional calendars.
Let’s analyze an example of a supermarket’s power hours metric in order to understand its potential for the decision-making process.
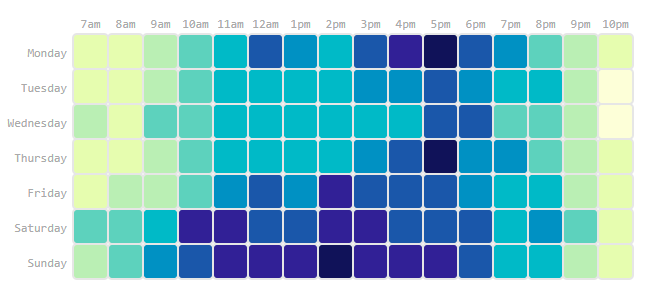
This example shows that the store receives most of its visits on weekends. On the contrary, the most unpopular days are Wednesdays, followed by Tuesdays and Thursdays. Knowing this, store managers will never launch a promotion on any of these unpopular days since it won’t obtain good results.
When it comes to busy hours, it must be noted that customers mainly visit the store as of 2 pm, so categories must be replenished before customers arrive and cleaning tasks must take place at noon.
Best windows
If we want to take a step further when analyzing in-store traffic, another metric that can come in handy is what we call the best windows. This metric combines traffic with the average time spent in-store.
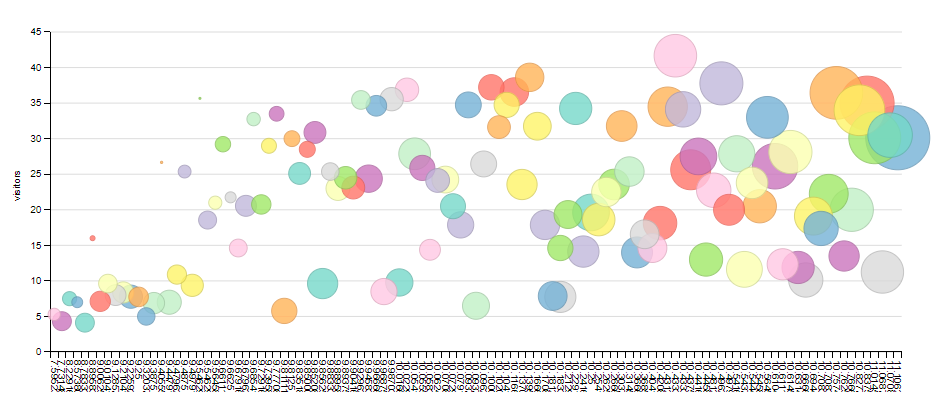
The y-axis represents the visitors per hour and the x-axis refers to Shoppermotion’s Window Index™, which takes into account the number of people, the length of the visit, and customers’ mobility throughout the store. Hence, big circles indicate those moments during a week that accumulate more traffic and longer visits. So, the bigger the circle, the better.
This metric is intended for big store formats, as the average time spent is more relevant for them (in convenience stores, the average dwell time is low since customers usually buy a low amount of products).
Store managers tend to analyze the impact of a campaign by measuring only the traffic received, but it is important to take into account the time spent as well. It is true that the more traffic, the more chances of increasing our conversion rates, but the more time spent, the more chances of shoppers visiting all categories. Therefore, at the end of the day, both ways can lead to an increase in sales. Let’s see this with an example comparing the orange and blue circles.
- Orange circle: Sunday 1-2 PM, average time 10.75, 36 visitors
- Blue circle: Saturday 1-2 PM, average time 11.10, 30 visitors
As we can see, the blue circle is bigger but the number of visitors is lower. What really makes a difference, in this case, is the average time, which is 3.3% higher than that of the orange circle. Therefore, this indicates that at some points the impact can be higher taking into account the time spent and not the number of customers.
Regarding the advantages of analyzing this metric, we can affirm that they are pretty similar to those explained in the power hours metric. Both metrics are significantly useful when deciding when to launch a promotion. Thanks to them we get to identify busy moments of the day and the week, so they let us identify the perfect moment to launch a campaign or to develop an in-store activation.
Conclusion
If we want to adapt our strategies to customers’ needs, it is important to analyze different types of information rather than only focusing on sales. For instance, traffic analysis tells us a lot about what is going on in our store and how our customers are behaving. Hence, it is essential to identify busy hours and off-peak moments to make effective decisions.
Thanks to metrics such as power hours and best windows, store managers can design store strategies based on enriched criteria that place customers at the center of their plan of action. Even though there are differences between both metrics, they tell us valuable information to take into account when deciding the best moments to launch campaigns.